< Portal:Mathematics < Featured picture
Picture of the month
Credit: unknown user on Ukrainian Wikipedia
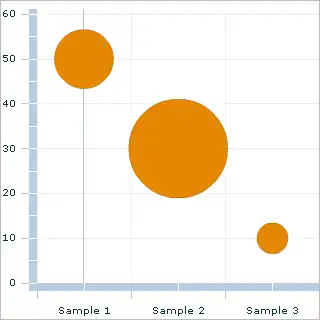
A bubble chart is a type of chart where each plotted entity is defined in terms of three distinct numeric parameters. The first two parameters are reflected in the chart as the horizontal and vertical coordinates of the center of each plotted "disc", as in a typical scatter plot, while the third determines the size of each disc. Bubble charts can facilitate the understanding of the social, economical, medical, and other scientific relationships.
| ...Archive | Read more... |
This article is issued from Wikipedia. The text is licensed under Creative Commons - Attribution - Sharealike. Additional terms may apply for the media files.