| |||||||||||||||||||||||||||||||||||||||||||||||||
All 533 English seats to the House of Commons 267 seats needed for English majority | |||||||||||||||||||||||||||||||||||||||||||||||||
|---|---|---|---|---|---|---|---|---|---|---|---|---|---|---|---|---|---|---|---|---|---|---|---|---|---|---|---|---|---|---|---|---|---|---|---|---|---|---|---|---|---|---|---|---|---|---|---|---|---|
| |||||||||||||||||||||||||||||||||||||||||||||||||
 *Seat figure does not include Speaker of the House of Commons Lindsay Hoyle, who was included in the Labour seat total by some media outlets. | |||||||||||||||||||||||||||||||||||||||||||||||||


The 2019 United Kingdom general election in England was held on Thursday 12 December across 533 constituencies within England.
Results
| Party[1] | Seats | Votes | |||||||
|---|---|---|---|---|---|---|---|---|---|
| Total | Gains | Losses | Net +/- | % seats | Total votes | % votes | Change | ||
| Conservative | 345 | 52 | 3 | 64.7 | 12,710,845 | 47.2 | |||
| Labour | 180 | 1 | 48 | 33.7 | 9,152,034 | 34.0 | |||
| Liberal Democrats | 7 | 2 | 3 | 1.3 | 3,340,835 | 12.4 | |||
| Green | 1 | 0 | 0 | 0.2 | 819,751 | 3.0 | |||
| Brexit Party | 0 | 0 | 0 | — | 545,172 | 2.0 | |||
| Yorkshire | 0 | 0 | 0 | — | 29,201 | 0.1 | |||
| UKIP | 0 | 0 | 0 | — | 18,891 | 0.1 | |||
| Liberal | 0 | 0 | 0 | — | 10,876 | 0.0 | |||
| Change UK | 0 | 0 | 0 | — | 10,006 | 0.0 | new | ||
| Monster Raving Loony | 0 | 0 | 0 | — | 9,394 | 0.0 | |||
| CPA | 0 | 0 | 0 | — | 6,246 | 0.0 | |||
| Animal Welfare | 0 | 0 | 0 | — | 3,086 | 0.0 | |||
| SDP | 0 | 0 | 0 | — | 3,000 | 0.0 | |||
| English Democrat | 0 | 0 | 0 | — | 1,987 | 0.0 | |||
| Libertarian | 0 | 0 | 0 | — | 1,375 | 0.0 | |||
| Workers Revolutionary | 0 | 0 | 0 | — | 524 | 0.0 | |||
| Advance | 0 | 0 | 0 | — | 351 | 0.0 | new | ||
| Others | 0 | 0 | 0 | — | 246,094 | 0.9 | |||
| 26,909,668 | 67.4 | ||||||||
Note: the above figures include the Speaker being counted in the Labour totals, despite the Speaker being non-partisan.
Analysis
The Conservatives retained a majority of seats in England, with a net increase of 48 seats. They increased their share of the vote to their highest since 1970 and increased their share of the seats to their highest since 1987 and gained seats in the Labour Party's strongholds, specifically in areas which voted Leave in the 2016 EU referendum.
The Labour Party decreased their share of votes and suffered losses mostly to the Conservatives.
The Liberal Democrats increased their share of votes mostly in constituencies that voted Remain in the 2016 EU referendum, but failed to make any substantial gains in this election.
The Brexit Party gained votes from Labour, especially in Leave-voting constituencies, but failed to make any breakthrough in this election.
The Green Party increased its share of the vote but failed to make any gains, although it retained Brighton Pavilion.
Regional results
East Midlands
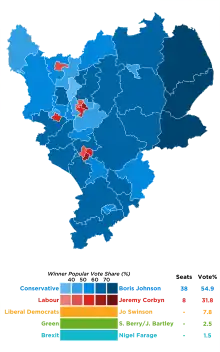
| Party | Seats | Votes | |||||||
|---|---|---|---|---|---|---|---|---|---|
| Total | Gains | Losses | Net +/- | % seats | Total votes | % votes | Change | ||
| Conservative | 38 | 7 | 0 | 82.6 | 1,280,724 | 54.9 | |||
| Labour | 8 | 0 | 7 | 17.4 | 740,975 | 31.8 | |||
| Liberal Democrats | 0 | 0 | 0 | 182,665 | 7.8 | ||||
| Green | 0 | 0 | 0 | 60,067 | 2.5 | ||||
| Brexit Party | 0 | 0 | 0 | 35,344 | 1.5 | ||||
| UKIP | 0 | 0 | 0 | 1,508 | 0.0 | ||||
| Others | 0 | 0 | 0 | 37,169 | 1.6 | ||||
| Total | 46 | 2,329,278 | 67.0 | ||||||
East of England

| Party | Seats | Votes | |||||||
|---|---|---|---|---|---|---|---|---|---|
| Total | Gains | Losses | Net +/- | % seats | Total votes | % votes | Change | ||
| Conservative | 52 | 3 | 1 | 89.6 | 1,754,097 | 57.2 | |||
| Labour | 5 | 0 | 2 | 8.6 | 749,906 | 24.5 | |||
| Liberal Democrats | 1 | 1 | 1 | 1.8 | 406,306 | 13.4 | |||
| Green | 0 | 0 | 0 | 90,965 | 2.9 | ||||
| Brexit Party | 0 | 0 | 0 | 11,742 | 0.4 | ||||
| UKIP | 0 | 0 | 0 | 1,169 | 0.0 | ||||
| Others | 0 | 0 | 0 | 49,582 | 1.6 | ||||
| Total | 58 | 3,063,767 | 68.2 | ||||||
London
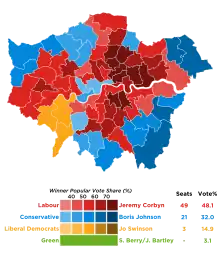
| Party | Seats | Votes | |||||||
|---|---|---|---|---|---|---|---|---|---|
| Total | Gains | Losses | Net +/- | % seats | Total votes | % votes | Change | ||
| Labour | 49 | 1 | 1 | 67.1 | 1,810,810 | 48.1 | |||
| Conservative | 21 | 2 | 2 | 28.8 | 1,205,127 | 32.0 | |||
| Liberal Democrats | 3 | 1 | 1 | 4.1 | 562,564 | 14.9 | |||
| Green | 0 | 0 | 0 | 115,527 | 3.1 | ||||
| Brexit Party | 0 | 0 | 0 | 51,692 | 1.4 | ||||
| Others | 0 | 0 | 0 | 18,361 | 0.5 | ||||
| Total | 73 | 3,764,084 | 67.7 | ||||||
North East England
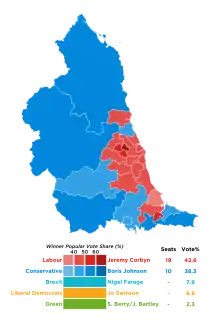
| Party | Seats | Votes | |||||||
|---|---|---|---|---|---|---|---|---|---|
| Total | Gains | Losses | Net +/- | % seats | Total votes | % votes | Change | ||
| Labour | 19 | 0 | 7 | 65.5 | 532,122 | 42.6 | |||
| Conservative | 10 | 7 | 0 | 34.5 | 478,208 | 38.3 | |||
| Brexit Party | 0 | 0 | 0 | 98,958 | 7.9 | ||||
| Liberal Democrats | 0 | 0 | 0 | 85,243 | 6.9 | ||||
| Green | 0 | 0 | 0 | 29,732 | 2.3 | ||||
| UKIP | 0 | 0 | 0 | 1,736 | 0.1 | ||||
| Others | 0 | 0 | 0 | 22,133 | 1.7 | ||||
| Total | 29 | 1,248,132 | 64.0 | ||||||
North West England
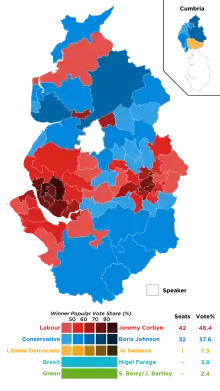
| Party | Seats | Votes | |||||||
|---|---|---|---|---|---|---|---|---|---|
| Total | Gains | Losses | Net +/- | % seats | Total votes | % votes | Change | ||
| Labour | 42 | 0 | 12 | 56 | 1,638,258 | 46.4 | |||
| Conservative | 32 | 12 | 0 | 42.7 | 1,321,190 | 37.6 | |||
| Liberal Democrats | 1 | 0 | 0 | 1.3 | 277,205 | 7.9 | |||
| Brexit Party | 0 | 0 | 0 | 136,196 | 3.8 | ||||
| Green | 0 | 0 | 0 | 86,815 | 2.4 | ||||
| UKIP | 0 | 0 | 0 | 2,333 | 0.0 | ||||
| Others | 0 | 0 | 0 | 61,505 | 1.7 | ||||
| Total | 75 | 3,523,802 | 65.7 | ||||||
South East England
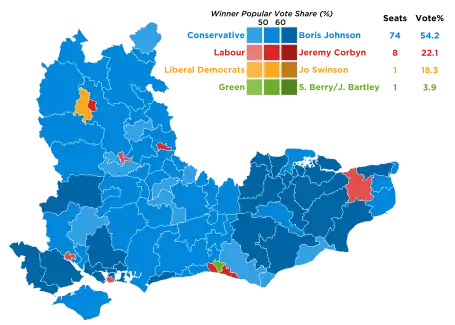
| Party | Seats | Votes | |||||||
|---|---|---|---|---|---|---|---|---|---|
| Total | Gains | Losses | Net +/- | % seats | Total votes | % votes | Change | ||
| Conservative | 74 | 2 | 0 | 88.1 | 2,512,924 | 54.2 | |||
| Labour | 8 | 0 | 0 | 9.5 | 1,029,996 | 22.1 | |||
| Liberal Democrats | 1 | 0 | 1 | 1.2 | 848,381 | 18.3 | |||
| Green | 1 | 0 | 0 | 1.2 | 183,724 | 3.9 | |||
| Brexit Party | 0 | 0 | 0 | 12,861 | 0.2 | ||||
| UKIP | 0 | 0 | 0 | 7,807 | 0.1 | ||||
| Others | 0 | 0 | 1 | 56,931 | 1.2 | ||||
| Total | 84 | 4,652,631 | 70.2 | ||||||
South West England
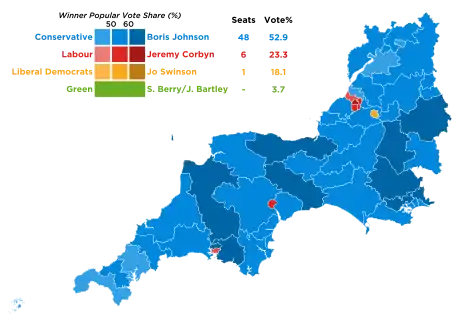
| Party | Seats | Votes | |||||||
|---|---|---|---|---|---|---|---|---|---|
| Total | Gains | Losses | Net +/- | % seats | Total votes | % votes | Change | ||
| Conservative | 48 | 1 | 0 | 87.3 | 1,612,090 | 52.9 | |||
| Labour | 6 | 0 | 1 | 10.9 | 713,226 | 23.3 | |||
| Liberal Democrats | 1 | 0 | 0 | 1.8 | 554,500 | 18.1 | |||
| Green | 0 | 0 | 0 | 115,011 | 3.7 | ||||
| Brexit Party | 0 | 0 | 0 | 11,139 | 0.3 | ||||
| UKIP | 0 | 0 | 0 | 1,227 | 0.0 | ||||
| Others | 0 | 0 | 0 | 46,184 | 1.5 | ||||
| Total | 55 | 3,053,377 | 72.0 | ||||||
West Midlands

| Party | Seats | Votes | |||||||
|---|---|---|---|---|---|---|---|---|---|
| Total | Gains | Losses | Net +/- | % seats | Total votes | % votes | Change | ||
| Conservative | 44 | 9 | 0 | 74.6 | 1,449,259 | 53.5 | |||
| Labour | 15 | 0 | 9 | 25.4 | 918,123 | 33.9 | |||
| Liberal Democrats | 0 | 0 | 0 | 213,903 | 7.9 | ||||
| Green | 0 | 0 | 0 | 80,556 | 2.9 | ||||
| Brexit Party | 0 | 0 | 0 | 36,646 | 1.3 | ||||
| UKIP | 0 | 0 | 0 | 1,068 | 0.0 | ||||
| Others | 0 | 0 | 0 | 12,369 | 0.4 | ||||
| Total | 59 | 2,711,924 | 64.3 | ||||||
Yorkshire and the Humber

| Party | Seats | Votes | |||||||
|---|---|---|---|---|---|---|---|---|---|
| Total | Gains | Losses | Net +/- | % seats | Total votes | % votes | Change | ||
| Labour | 28 | 0 | 9 | 51.9 | 989,787 | 38.8 | |||
| Conservative | 26 | 9 | 0 | 48.1 | 1,097,376 | 43.0 | |||
| Liberal Democrats | 0 | 0 | 0 | 205,225 | 8.0 | ||||
| Brexit Party | 0 | 0 | 0 | 150,582 | 5.9 | ||||
| Green | 0 | 0 | 0 | 57,362 | 2.2 | ||||
| Yorkshire | 0 | 0 | 0 | 29,201 | 1.14 | ||||
| UKIP | 0 | 0 | 0 | 983 | 0.0 | ||||
| Others | 0 | 0 | 0 | 16,420 | 0.6 | ||||
| Total | 54 | 2,546,936 | 64.1 | ||||||
Labour won the most seats in the region; however, the Conservatives won more votes.
Results by county
The below tables summarise the results by county as used by the Boundary Commission for England at the time of the last boundary review.
Avon
| Party | Seats | Votes | ||||
|---|---|---|---|---|---|---|
| Total | Net +/- | Total votes | % votes | Change | ||
| Conservative | 6 | 258,867 | 43.5 | |||
| Labour | 4 | 196,714 | 33.1 | |||
| Liberal Democrats | 1 | 97,767 | 16.4 | |||
| Green | 0 | 34,563 | 5.8 | |||
| Brexit Party | 0 | 5,717 | 0.9 | new | ||
| Others | 0 | 1,559 | 0.3 | |||
| Total | 11 | 594,747 | ||||
Bedfordshire
| Party | Seats | Votes | ||||
|---|---|---|---|---|---|---|
| Total | Net +/- | Total votes | % votes | Change | ||
| Conservative | 3 | 156,973 | 49.8 | |||
| Labour | 3 | 107,591 | 34.2 | |||
| Liberal Democrats | 0 | 28,276 | 9.0 | |||
| Green | 0 | 9,126 | 2.9 | |||
| Brexit Party | 0 | 3,712 | 1.2 | new | ||
| Others | 0 | 9,318 | 3.0 | |||
| Total | 6 | 314,996 | ||||
Berkshire
| Party | Seats | Votes | ||||
|---|---|---|---|---|---|---|
| Total | Net +/- | Total votes | % votes | Change | ||
| Conservative | 6 | 222,532 | 50.1 | |||
| Labour | 2 | 115,747 | 26.1 | |||
| Liberal Democrats | 0 | 87,532 | 19.7 | |||
| Green | 0 | 13,796 | 3.1 | |||
| Brexit Party | 0 | 2,284 | 0.5 | new | ||
| Others | 0 | 2,044 | 0.5 | |||
| Total | 8 | 443,935 | ||||
Buckinghamshire
| Party | Seats | Votes | ||||
|---|---|---|---|---|---|---|
| Total | Net +/- | Total votes | % votes | Change | ||
| Conservative | 7 | 220,814 | 52.7 | |||
| Labour | 0 | 106,226 | 25.4 | |||
| Liberal Democrats | 0 | 57,554 | 13.7 | |||
| Green | 0 | 12,349 | 2.9 | |||
| Brexit Party | 0 | 1,286 | 0.3 | new | ||
| Others | 0 | 20,664 | 4.9 | |||
| Total | 7 | 418,893 | ||||
Cambridgeshire
| Party | Seats | Votes | ||||
|---|---|---|---|---|---|---|
| Total | Net +/- | Total votes | % votes | Change | ||
| Conservative | 6 | 204,994 | 50.1 | |||
| Labour | 1 | 99,582 | 24.3 | |||
| Liberal Democrats | 0 | 87,890 | 21.5 | |||
| Green | 0 | 9,959 | 2.4 | |||
| Brexit Party | 0 | 3,168 | 0.8 | new | ||
| Others | 0 | 3,895 | 1.0 | |||
| Total | 7 | 409,488 | ||||
Cheshire
| Party | Seats | Votes | ||||
|---|---|---|---|---|---|---|
| Total | Net +/- | Total votes | % votes | Change | ||
| Conservative | 6 | 267,127 | 46.4 | |||
| Labour | 5 | 227,481 | 39.5 | |||
| Liberal Democrats | 0 | 51,665 | 9.0 | |||
| Brexit Party | 0 | 14,287 | 2.5 | new | ||
| Green | 0 | 13,872 | 2.4 | |||
| Others | 0 | 1,426 | 0.2 | |||
| Total | 11 | 575,858 | ||||
Cleveland
| Party | Seats | Votes | ||||
|---|---|---|---|---|---|---|
| Total | Net +/- | Total votes | % votes | Change | ||
| Conservative | 3 | 112,092 | 43.5 | |||
| Labour | 3 | 104,701 | 40.6 | |||
| Brexit Party | 0 | 21,789 | 8.5 | new | ||
| Liberal Democrats | 0 | 8,499 | 3.3 | |||
| Green | 0 | 2,257 | 0.9 | |||
| Others | 0 | 8,465 | 3.3 | |||
| Total | 6 | 257,803 | ||||
Cornwall
| Party | Seats | Votes | ||||
|---|---|---|---|---|---|---|
| Total | Net +/- | Total votes | % votes | Change | ||
| Conservative | 6 | 173,027 | 53.8 | |||
| Labour | 0 | 74,392 | 23.1 | |||
| Liberal Democrats | 0 | 62,165 | 19.3 | |||
| Green | 0 | 7,129 | 2.2 | |||
| Brexit Party | did not contest | |||||
| Others | 0 | 5,262 | 1.6 | |||
| Total | 6 | 321,975 | ||||
County Durham
| Party | Seats | Votes | ||||
|---|---|---|---|---|---|---|
| Total | Net +/- | Total votes | % votes | Change | ||
| Conservative | 4 | 123,112 | 40.6 | |||
| Labour | 3 | 122,547 | 40.4 | |||
| Brexit Party | 0 | 25,444 | 8.4 | new | ||
| Liberal Democrats | 0 | 21,356 | 7.0 | |||
| Green | 0 | 5,985 | 2.0 | |||
| Others | 0 | 4,725 | 1.6 | |||
| Total | 7 | 303,260 | ||||
Cumbria
| Party | Seats | Votes | ||||
|---|---|---|---|---|---|---|
| Total | Net +/- | Total votes | % votes | Change | ||
| Conservative | 5 | 143,615 | 52.4 | |||
| Labour | 0 | 79,402 | 28.9 | |||
| Liberal Democrats | 1 | 39,426 | 14.4 | |||
| Green | 0 | 4,223 | 1.5 | |||
| Brexit Party | 0 | 3,867 | 1.4 | new | ||
| Others | 0 | 3,044 | 1.1 | |||
| Total | 6 | 274,313 | ||||
Derbyshire
| Party | Seats | Votes | ||||
|---|---|---|---|---|---|---|
| Total | Net +/- | Total votes | % votes | Change | ||
| Conservative | 9 | 277,712 | 52.3 | |||
| Labour | 2 | 184,295 | 34.7 | |||
| Liberal Democrats | 0 | 38,253 | 7.2 | |||
| Brexit Party | 0 | 14,487 | 2.7 | new | ||
| Green | 0 | 13,658 | 2.6 | |||
| Others | 0 | 2,711 | 0.5 | |||
| Total | 11 | 531,116 | ||||
Devon
| Party | Seats | Votes | ||||
|---|---|---|---|---|---|---|
| Total | Net +/- | Total votes | % votes | Change | ||
| Conservative | 10 | 355,052 | 53.9 | |||
| Labour | 2 | 150,169 | 22.8 | |||
| Liberal Democrats | 0 | 96,809 | 14.7 | |||
| Green | 0 | 22,000 | 3.3 | |||
| Brexit Party | 0 | 4,337 | 0.7 | new | ||
| Others | 0 | 30,836 | 4.7 | |||
| Total | 12 | 659,203 | ||||
Dorset
| Party | Seats | Votes | ||||
|---|---|---|---|---|---|---|
| Total | Net +/- | Total votes | % votes | Change | ||
| Conservative | 8 | 241,835 | 58.3 | |||
| Liberal Democrats | 0 | 78,414 | 18.9 | |||
| Labour | 0 | 76,310 | 18.4 | |||
| Green | 0 | 16,020 | 3.9 | |||
| Others | 0 | 2,094 | 0.5 | |||
| Brexit Party | did not contest | |||||
| Total | 8 | 414,673 | ||||
East Sussex
| Party | Seats | Votes | ||||
|---|---|---|---|---|---|---|
| Total | Net +/- | Total votes | % votes | Change | ||
| Conservative | 5 | 197,728 | 44.2 | |||
| Labour | 2 | 121,935 | 27.3 | |||
| Liberal Democrats | 0 | 75,754 | 16.9 | |||
| Green | 1 | 45,128 | 10.1 | |||
| Brexit Party | 0 | 4,738 | 1.1 | new | ||
| Others | 0 | 1,898 | 0.4 | |||
| Total | 8 | 447,181 | ||||
Essex
| Party | Seats | Votes | ||||
|---|---|---|---|---|---|---|
| Total | Net +/- | Total votes | % votes | Change | ||
| Conservative | 18 | 577,118 | 64.5 | |||
| Labour | 0 | 189,471 | 21.2 | |||
| Liberal Democrats | 0 | 95,078 | 10.6 | |||
| Green | 0 | 20,438 | 2.3 | |||
| Others | 0 | 12,502 | 1.4 | |||
| Brexit Party | did not contest | |||||
| Total | 18 | 894,607 | ||||
Gloucestershire
| Party | Seats | Votes | ||||
|---|---|---|---|---|---|---|
| Total | Net +/- | Total votes | % votes | Change | ||
| Conservative | 6 | 191,119 | 54.2 | |||
| Labour | 0 | 80,776 | 22.9 | |||
| Liberal Democrats | 0 | 60,431 | 17.1 | |||
| Green | 0 | 17,116 | 4.9 | |||
| Brexit Party | 0 | 1,085 | 0.3 | new | ||
| Others | 0 | 2,315 | 0.7 | |||
| Total | 6 | 352,842 | ||||
Greater Manchester
| Party | Seats | Votes | ||||
|---|---|---|---|---|---|---|
| Total | Net +/- | Total votes | % votes | Change | ||
| Labour | 18 | 597,271 | 47.8 | |||
| Conservative | 9 | 438,647 | 35.1 | |||
| Liberal Democrats | 0 | 109,555 | 8.8 | |||
| Brexit Party | 0 | 68,462 | 5.5 | new | ||
| Green | 0 | 29,642 | 2.4 | |||
| Others | 0 | 6,602 | 0.5 | |||
| Total | 27 | 1,250,179 | ||||
Hampshire
| Party | Seats | Votes | ||||
|---|---|---|---|---|---|---|
| Total | Net +/- | Total votes | % votes | Change | ||
| Conservative | 16 | 536,633 | 57.1 | |||
| Labour | 2 | 188,738 | 20.1 | |||
| Liberal Democrats | 0 | 175,173 | 18.6 | |||
| Green | 0 | 30,710 | 3.3 | |||
| Brexit Party | 0 | 2,585 | 0.3 | new | ||
| Others | 0 | 6,473 | 0.6 | |||
| Total | 18 | 940,312 | ||||
Herefordshire
| Party | Seats | Votes | ||||
|---|---|---|---|---|---|---|
| Total | Net +/- | Total votes | % votes | Change | ||
| Conservative | 2 | 62,548 | 62.1 | |||
| Labour | 0 | 17,508 | 17.4 | |||
| Liberal Democrats | 0 | 13,483 | 13.4 | |||
| Green | 0 | 7,140 | 7.1 | |||
| Brexit Party | did not contest | |||||
| Others | 0 | 0 | 0 | |||
| Total | 2 | 100,679 | ||||
Hertfordshire
| Party | Seats | Votes | ||||
|---|---|---|---|---|---|---|
| Total | Net +/- | Total votes | % votes | Change | ||
| Conservative | 10 | 317,018 | 52.7 | |||
| Labour | 0 | 141,143 | 23.5 | |||
| Liberal Democrats | 1 | 110,006 | 18.3 | |||
| Green | 0 | 15,132 | 2.5 | |||
| Brexit Party | did not contest | |||||
| Others | 0 | 17,764 | 3.0 | |||
| Total | 11 | 601,063 | ||||
Humberside
| Party | Seats | Votes | ||||
|---|---|---|---|---|---|---|
| Total | Net +/- | Total votes | % votes | Change | ||
| Conservative | 7 | 231,091 | 55.7 | |||
| Labour | 3 | 122,074 | 29.4 | |||
| Liberal Democrats | 0 | 26,312 | 6.3 | |||
| Brexit Party | 0 | 20,595 | 5.0 | new | ||
| Green | 0 | 10,275 | 2.5 | |||
| Others | 0 | 4,322 | 1.1 | |||
| Total | 10 | 414,669 | ||||
Kent
| Party | Seats | Votes | ||||
|---|---|---|---|---|---|---|
| Total | Net +/- | Total votes | % votes | Change | ||
| Conservative | 16 | 532,342 | 60.2 | |||
| Labour | 1 | 221,554 | 25.0 | |||
| Liberal Democrats | 0 | 91,613 | 10.4 | |||
| Green | 0 | 24,583 | 2.8 | |||
| Others | 0 | 14,492 | 1.6 | |||
| Total | 17 | 884,584 | ||||
Lancashire
| Party | Seats | Votes | ||||
|---|---|---|---|---|---|---|
| Total | Net +/- | Total votes | % votes | Change | ||
| Conservative | 11 | 331,248 | 46.2 | |||
| Labour | 4 | 270,733 | 37.8 | |||
| Liberal Democrats | 0 | 37,268 | 5.2 | |||
| Speaker | 1 | 26,831 | 3.7 | new | ||
| Green | 0 | 19,707 | 2.7 | |||
| Brexit Party | 0 | 16,188 | 2.3 | new | ||
| Others | 0 | 14,492 | 2.0 | |||
| Total | 16 | 716,467 | ||||
Leicestershire and Rutland
| Party | Seats | Votes | ||||
|---|---|---|---|---|---|---|
| Total | Net +/- | Total votes | % votes | Change | ||
| Conservative | 7 | 281,019 | 53.3 | |||
| Labour | 3 | 169,475 | 32.1 | |||
| Liberal Democrats | 0 | 51,606 | 9.8 | |||
| Green | 0 | 18,705 | 3.5 | |||
| Brexit Party | 0 | 4,050 | 0.8 | new | ||
| Others | 0 | 2,835 | 0.5 | |||
| Total | 10 | 527,690 | ||||
Lincolnshire
| Party | Seats | Votes | ||||
|---|---|---|---|---|---|---|
| Total | Net +/- | Total votes | % votes | Change | ||
| Conservative | 7 | 246,959 | 67.2 | |||
| Labour | 0 | 76,583 | 20.8 | |||
| Liberal Democrats | 0 | 28,389 | 7.7 | |||
| Green | 0 | 6,815 | 1.9 | |||
| Brexit Party | 0 | 1,079 | 0.3 | new | ||
| Others | 0 | 7,614 | 2.1 | |||
| Total | 7 | 367,439 | ||||
Merseyside
| Party | Seats | Votes | ||||
|---|---|---|---|---|---|---|
| Total | Net +/- | Total votes | % votes | Change | ||
| Labour | 14 | 463,371 | 65.2 | |||
| Conservative | 1 | 143,431 | 20.2 | |||
| Liberal Democrats | 0 | 39,591 | 5.6 | |||
| Brexit Party | 0 | 33,392 | 4.7 | new | ||
| Green | 0 | 19,371 | 2.7 | |||
| Others | 0 | 11,443 | 1.6 | |||
| Total | 15 | 710,599 | ||||
Norfolk
| Party | Seats | Votes | ||||
|---|---|---|---|---|---|---|
| Total | Net +/- | Total votes | % votes | Change | ||
| Conservative | 8 | 268,165 | 57.2 | |||
| Labour | 1 | 123,780 | 26.4 | |||
| Liberal Democrats | 0 | 57,966 | 12.4 | |||
| Green | 0 | 11,812 | 2.5 | |||
| Brexit Party | 0 | 3,395 | 0.7 | new | ||
| Others | 0 | 3,840 | 0.8 | |||
| Total | 9 | 468,958 | ||||
Northamptonshire
| Party | Seats | Votes | ||||
|---|---|---|---|---|---|---|
| Total | Net +/- | Total votes | % votes | Change | ||
| Conservative | 7 | 216,229 | 59.0 | |||
| Labour | 0 | 106,611 | 29.1 | |||
| Liberal Democrats | 0 | 30,804 | 8.4 | |||
| Green | 0 | 10,514 | 2.9 | |||
| Others | 0 | 2,276 | 0.6 | |||
| Total | 7 | 366,434 | ||||
Northumberland
| Party | Seats | Votes | ||||
|---|---|---|---|---|---|---|
| Total | Net +/- | Total votes | % votes | Change | ||
| Conservative | 3 | 82,849 | 48.8 | |||
| Labour | 1 | 57,567 | 33.9 | |||
| Liberal Democrats | 0 | 17,018 | 10.0 | |||
| Brexit Party | 0 | 6,535 | 3.9 | new | ||
| Green | 0 | 5,480 | 3.2 | |||
| Others | 0 | 178 | 0.2 | |||
| Total | 4 | 169,627 | ||||
North Yorkshire
| Party | Seats | Votes | ||||
|---|---|---|---|---|---|---|
| Total | Net +/- | Total votes | % votes | Change | ||
| Conservative | 7 | 239,887 | 54.4 | |||
| Labour | 1 | 112,500 | 25.5 | |||
| Liberal Democrats | 0 | 64,772 | 14.7 | |||
| Green | 0 | 11,441 | 2.6 | |||
| Brexit Party | 0 | 1,479 | 0.3 | new | ||
| Others | 0 | 10,867 | 2.5 | |||
| Total | 8 | 440,946 | ||||
Nottinghamshire
| Party | Seats | Votes | ||||
|---|---|---|---|---|---|---|
| Total | Net +/- | Total votes | % votes | Change | ||
| Conservative | 8 | 258,794 | 47.4 | |||
| Labour | 3 | 204,011 | 37.4 | |||
| Liberal Democrats | 0 | 33,315 | 6.1 | |||
| Brexit Party | 0 | 15,728 | 2.9 | new | ||
| Green | 0 | 10,375 | 1.9 | |||
| Others | 0 | 23,241 | 4.3 | |||
| Total | 11 | 545,464 | ||||
Oxfordshire
| Party | Seats | Votes | ||||
|---|---|---|---|---|---|---|
| Total | Net +/- | Total votes | % votes | Change | ||
| Conservative | 4 | 166,978 | 46.6 | |||
| Liberal Democrats | 1 | 105,302 | 24.3 | |||
| Labour | 1 | 74,377 | 20.8 | |||
| Green | 0 | 7,735 | 2.2 | |||
| Brexit Party | 0 | 1,975 | 0.5 | new | ||
| Others | 0 | 1,974 | 0.5 | |||
| Total | 6 | 358,341 | ||||
Shropshire
| Party | Seats | Votes | ||||
|---|---|---|---|---|---|---|
| Total | Net +/- | Total votes | % votes | Change | ||
| Conservative | 5 | 155,225 | 60.3 | |||
| Labour | 0 | 66,798 | 29.4 | |||
| Liberal Democrats | 0 | 26,827 | 10.4 | |||
| Green | 0 | 6,955 | 2.7 | |||
| Others | 0 | 1,713 | 0.7 | |||
| Total | 5 | 257,518 | ||||
Somerset
| Party | Seats | Votes | ||||
|---|---|---|---|---|---|---|
| Total | Net +/- | Total votes | % votes | Change | ||
| Conservative | 5 | 174,145 | 56.7 | |||
| Liberal Democrats | 0 | 89,038 | 29.0 | |||
| Labour | 0 | 32,522 | 10.6 | |||
| Green | 0 | 6,801 | 2.2 | |||
| Others | 0 | 4,600 | 1.5 | |||
| Brexit Party | did not contest | |||||
| Total | 5 | 307,106 | ||||
South Yorkshire
| Party | Seats | Votes | ||||
|---|---|---|---|---|---|---|
| Total | Net +/- | Total votes | % votes | Change | ||
| Labour | 11 | 257,978 | 42.2 | |||
| Conservative | 3 | 196,969 | 32.3 | |||
| Brexit Party | 0 | 82,838 | 13.6 | new | ||
| Liberal Democrats | 0 | 47,831 | 7.8 | |||
| Others | 0 | 24,607 | 4.0 | |||
| Total | 14 | 610,223 | ||||
Staffordshire
| Party | Seats | Votes | ||||
|---|---|---|---|---|---|---|
| Total | Net +/- | Total votes | % votes | Change | ||
| Conservative | 12 | 336,621 | 61.6 | |||
| Labour | 0 | 154,301 | 28.2 | |||
| Liberal Democrats | 0 | 30,431 | 5.6 | |||
| Green | 0 | 16,826 | 3.1 | |||
| Brexit Party | 0 | 5,986 | 1.1 | new | ||
| Others | 0 | 2,135 | 0.4 | |||
| Total | 12 | 546,300 | ||||
Suffolk
| Party | Seats | Votes | ||||
|---|---|---|---|---|---|---|
| Total | Net +/- | Total votes | % votes | Change | ||
| Conservative | 7 | 229,823 | 60.1 | |||
| Labour | 0 | 91,339 | 23.9 | |||
| Liberal Democrats | 0 | 31,633 | 8.3 | |||
| Green | 0 | 24,490 | 6.4 | |||
| Brexit Party | 0 | 1,432 | 0.4 | new | ||
| Others | 0 | 3,432 | 0.9 | |||
| Total | 7 | 382,149 | ||||
Surrey
| Party | Seats | Votes | ||||
|---|---|---|---|---|---|---|
| Total | Net +/- | Total votes | % votes | Change | ||
| Conservative | 11 | 336,561 | 53.8 | |||
| Liberal Democrats | 0 | 179,581 | 28.6 | |||
| Labour | 0 | 79,895 | 12.7 | |||
| Green | 0 | 13,650 | 2.7 | |||
| Others | 0 | 11,165 | 2.2 | |||
| Brexit Party | did not contest | |||||
| Total | 11 | 626,852 | ||||
Tyne and Wear
| Party | Seats | Votes | ||||
|---|---|---|---|---|---|---|
| Total | Net +/- | Total votes | % votes | Change | ||
| Labour | 12 | 247,317 | 47.8 | |||
| Conservative | 0 | 160,155 | 30.9 | |||
| Brexit Party | 0 | 47,142 | 9.1 | new | ||
| Liberal Democrats | 0 | 36,417 | 7.0 | |||
| Green | 0 | 16,010 | 3.1 | |||
| Others | 0 | 10,504 | 2.0 | |||
| Total | 12 | 517,545 | ||||
Warwickshire
| Party | Seats | Votes | ||||
|---|---|---|---|---|---|---|
| Total | Net +/- | Total votes | % votes | Change | ||
| Conservative | 5 | 173,517 | 57.1 | |||
| Labour | 1 | 81,727 | 26.9 | |||
| Liberal Democrats | 0 | 36,502 | 12.0 | |||
| Green | 0 | 10,538 | 3.5 | |||
| Brexit Party | 0 | 807 | 0.3 | new | ||
| Others | 0 | 677 | 0.2 | |||
| Total | 6 | 303,768 | ||||
West Midlands (county)
| Party | Seats | Votes | ||||
|---|---|---|---|---|---|---|
| Total | Net +/- | Total votes | % votes | Change | ||
| Conservative | 14 | 527,912 | 44.4 | |||
| Labour | 14 | 524,617 | 44.1 | |||
| Liberal Democrats | 0 | 72,315 | 6.1 | |||
| Brexit Party | 0 | 29,863 | 2.5 | new | ||
| Green | 0 | 27,371 | 2.3 | |||
| Others | 0 | 7,690 | 0.6 | |||
| Total | 28 | 1,189,768 | ||||
West Sussex
| Party | Seats | Votes | ||||
|---|---|---|---|---|---|---|
| Total | Net +/- | Total votes | % votes | Change | ||
| Conservative | 8 | 257,463 | 56.3 | |||
| Labour | 0 | 103,446 | 22.6 | |||
| Liberal Democrats | 0 | 75,512 | 16.5 | |||
| Green | 0 | 17,239 | 3.8 | |||
| Others | 0 | 3,920 | 0.8 | |||
| Total | 8 | 457,580 | ||||
West Yorkshire
| Party | Seats | Votes | ||||
|---|---|---|---|---|---|---|
| Total | Net +/- | Total votes | % votes | Change | ||
| Labour | 13 | 497,235 | 46.0 | |||
| Conservative | 9 | 429,429 | 39.7 | |||
| Liberal Democrats | 0 | 66,310 | 6.1 | |||
| Brexit Party | 0 | 45,667 | 4.2 | new | ||
| Green | 0 | 21,562 | 2.0 | |||
| Others | 0 | 20,909 | 1.9 | |||
| Total | 22 | 1,081,112 | ||||
Wiltshire
| Party | Seats | Votes | ||||
|---|---|---|---|---|---|---|
| Total | Net +/- | Total votes | % votes | Change | ||
| Conservative | 7 | 217,955 | 57.8 | |||
| Labour | 0 | 77,343 | 20.5 | |||
| Liberal Democrats | 0 | 69,876 | 18.5 | |||
| Green | 0 | 11,378 | 3.0 | |||
| Others | 0 | 745 | 0.2 | |||
| Total | 7 | 377,297 | ||||
Worcestershire
| Party | Seats | Votes | ||||
|---|---|---|---|---|---|---|
| Total | Net +/- | Total votes | % votes | Change | ||
| Conservative | 6 | 193,466 | 61.7 | |||
| Labour | 0 | 72,722 | 23.2 | |||
| Liberal Democrats | 0 | 34,315 | 10.9 | |||
| Green | 0 | 11,726 | 3.7 | |||
| Others | 0 | 1,222 | 0.4 | |||
| Total | 6 | 313,451 | ||||
Results by constituency
| Constituency | County | Region | 2017 result |
2019 winning party | Turnout[lower-alpha 1] | Votes | |||||||||||
|---|---|---|---|---|---|---|---|---|---|---|---|---|---|---|---|---|---|
| Party | Votes | Share | Majority | Con | Lab[lower-alpha 2][lower-alpha 3] | LD | Grn | Brx | Other[lower-alpha 4] | Total | |||||||
| Aldershot | HAM | SE | Con | Con | 27,980 | 58.4% | 16,698 | 66.0% | 27,980 | 11,282 | 6,920 | 1,750 | 47,932 | ||||
| Aldridge-Brownhills | WMD | WM | Con | Con | 27,850 | 70.5% | 19,836 | 65.4% | 27,850 | 8,014 | 2,371 | 771 | 336 | 39,006 | |||
| Altrincham and Sale West | GTM | NW | Con | Con | 26,311 | 48.0% | 6,139 | 74.9% | 26,311 | 20,172 | 6,036 | 1,566 | 778 | 54,863 | |||
| Amber Valley | DBY | EM | Con | Con | 29,096 | 63.9% | 16,886 | 65.1% | 29,096 | 12,210 | 2,873 | 1,388 | 45,567 | ||||
| Arundel and South Downs | WSX | SE | Con | Con | 35,566 | 57.9% | 22,521 | 75.1% | 35,566 | 9,722 | 13,045 | 2,519 | 556 | 61,368 | |||
| Ashfield | NTT | EM | Lab | Con | 19,231 | 39.3% | 5,733 | 62.6% | 19,231 | 11,971 | 1,105 | 674 | 2,501 | 13,498 | 48,980 | ||
| Ashford | KEN | SE | Con | Con | 37,270 | 62.1% | 24,029 | 67.1% | 37,270 | 13,241 | 6,048 | 2,638 | 862 | 60,059 | |||
| Ashton-under-Lyne | GTM | NW | Lab | Lab | 18,544 | 48.1% | 4,263 | 56.3% | 14,281 | 18,544 | 1,395 | 1,208 | 3,151 | 38,579 | |||
| Aylesbury | BKM | SE | Con | Con | 32,737 | 54.0% | 17,373 | 69.9% | 32,737 | 15,364 | 10,081 | 2,394 | 60,576 | ||||
| Banbury | OXF | SE | Con | Con | 34,148 | 54.3% | 16,813 | 69.8% | 34,148 | 17,335 | 8,831 | 2,607 | 62,921 | ||||
| Barking | LND | LND | Lab | Lab | 27,219 | 61.2% | 15,427 | 57.1% | 11,792 | 27,219 | 1,482 | 820 | 3,186 | 44,499 | |||
| Barnsley Central | SYK | YTH | Lab | Lab | 14,804 | 40.1% | 3,571 | 56.5% | 7,892 | 14,804 | 1,176 | 900 | 11,233 | 898 | 36,903 | ||
| Barnsley East | SYK | YTH | Lab | Lab | 14,329 | 37.6% | 3,217 | 54.8% | 10,377 | 14,329 | 1,330 | 922 | 11,112 | 38,070 | |||
| Barrow and Furness | CMA | NW | Lab | Con | 23,876 | 51.9% | 5,789 | 65.6% | 23,876 | 18,087 | 2,025 | 703 | 1,355 | 46,046 | |||
| Basildon and Billericay | ESS | E | Con | Con | 29,590 | 67.1% | 20,412 | 63.1% | 29,590 | 9,178 | 3,741 | 1,395 | 224 | 44,128 | |||
| Basingstoke | HAM | SE | Con | Con | 29,593 | 54.1% | 14,198 | 66.0% | 29,593 | 15,395 | 6,841 | 2,138 | 746 | 54,713 | |||
| Bassetlaw | NTT | EM | Lab | Con | 28,078 | 55.2% | 14,013 | 63.5% | 28,078 | 14,065 | 3,332 | 5,366 | 50,841 | ||||
| Bath | AVN | SW | LD | LD | 28,419 | 54.5% | 12,322 | 77.2% | 16,097 | 6,639 | 28,419 | 642 | 341 | 52,138 | |||
| Batley and Spen | WYK | YTH | Lab | Lab | 22,594 | 42.7% | 3,525 | 66.5% | 19,069 | 22,594 | 2,462 | 692 | 1,678 | 6,432 | 52,927 | ||
| Battersea | LND | LND | Lab | Lab | 27,290 | 45.5% | 5,668 | 75.6% | 21,622 | 27,290 | 9,150 | 1,529 | 386 | 59,977 | |||
| Beaconsfield | BKM | SE | Con | Con | 32,477 | 56.1% | 15,712 | 74.5% | 32,477 | 5,756 | 2,033 | 17,602 | 57,868 | ||||
| Beckenham | LND | LND | Con | Con | 27,282 | 54.0% | 14,258 | 73.6% | 27,282 | 13,024 | 8,194 | 2,055 | 50,555 | ||||
| Bedford | BDF | E | Lab | Lab | 20,491 | 43.3% | 145 | 66.1% | 20,346 | 20,491 | 4,608 | 960 | 896 | 47,301 | |||
| Bermondsey and Old Southwark | LND | LND | Lab | Lab | 31,723 | 54.1% | 16,126 | 62.8% | 9,678 | 31,723 | 15,597 | 1,617 | 58,615 | ||||
| Berwick-upon-Tweed | NBL | NE | Con | Con | 23,947 | 56.9% | 14,835 | 70.3% | 23,947 | 9,112 | 7,656 | 1,394 | 42,109 | ||||
| Bethnal Green and Bow | LND | LND | Lab | Lab | 44,052 | 72.7% | 37,524 | 68.7% | 6,528 | 44,052 | 5,892 | 2,570 | 1,081 | 439 | 60,562 | ||
| Beverley and Holderness | HUM | YTH | Con | Con | 33,250 | 62.1% | 20,448 | 67.2% | 33,250 | 12,802 | 4,671 | 1,378 | 1,441 | 53,542 | |||
| Bexhill and Battle | SXE | SE | Con | Con | 37,590 | 63.6% | 26,059 | 72.1% | 37,590 | 11,531 | 7,280 | 2,692 | 59,093 | ||||
| Bexleyheath and Crayford | LND | LND | Con | Con | 25,856 | 59.8% | 13,103 | 66.1% | 25,856 | 12,753 | 2,819 | 1,298 | 520 | 43,246 | |||
| Birkenhead | MSY | NW | Lab | Lab | 24,990 | 59.0% | 17,705 | 66.4% | 5,540 | 24,990 | 1,620 | 1,405 | 1,489 | 7,285 | 42,329 | ||
| Birmingham Edgbaston | WMD | WM | Lab | Lab | 21,217 | 50.1% | 5,614 | 61.5% | 15,603 | 21,217 | 3,349 | 1,112 | 1,047 | 42,328 | |||
| Birmingham Erdington | WMD | WM | Lab | Lab | 17,720 | 50.3% | 3,601 | 53.3% | 14,119 | 17,720 | 1,301 | 648 | 1,441 | 35,229 | |||
| Birmingham Hall Green | WMD | WM | Lab | Lab | 35,889 | 67.8% | 28,508 | 65.9% | 7,381 | 35,889 | 3,673 | 818 | 877 | 4,273 | 52,911 | ||
| Birmingham Hodge Hill | WMD | WM | Lab | Lab | 35,397 | 78.7% | 28,655 | 57.5% | 6,742 | 35,397 | 760 | 328 | 1,519 | 257 | 45,003 | ||
| Birmingham Ladywood | WMD | WM | Lab | Lab | 33,355 | 79.2% | 28,582 | 56.2% | 4,773 | 33,355 | 2,228 | 931 | 831 | 42,118 | |||
| Birmingham Northfield | WMD | WM | Lab | Con | 19,957 | 46.3% | 1,640 | 58.5% | 19,957 | 18,317 | 1,961 | 954 | 1,655 | 254 | 43,098 | ||
| Birmingham Perry Barr | WMD | WM | Lab | Lab | 26,594 | 63.1% | 15,317 | 58.5% | 11,277 | 26,594 | 1,901 | 845 | 1,382 | 148 | 42,147 | ||
| Birmingham Selly Oak | WMD | WM | Lab | Lab | 27,714 | 56.0% | 12,414 | 59.8% | 15,300 | 27,714 | 3,169 | 1,848 | 1,436 | 49,467 | |||
| Birmingham Yardley | WMD | WM | Lab | Lab | 23,379 | 54.8% | 10,659 | 57.1% | 12,720 | 23,379 | 3,754 | 579 | 2,246 | 42,678 | |||
| Bishop Auckland | DUR | NE | Lab | Con | 24,067 | 53.7% | 7,692 | 65.7% | 24,067 | 16,105 | 2,133 | 2,500 | 44,805 | ||||
| Blackburn | LAN | NW | Lab | Lab | 29,040 | 64.9% | 18,304 | 62.8% | 10,736 | 29,040 | 1,130 | 741 | 2,770 | 319 | 44,736 | ||
| Blackley and Broughton | GTM | NW | Lab | Lab | 23,887 | 61.9% | 14,402 | 52.8% | 9,485 | 23,887 | 1,590 | 920 | 2,736 | 38,760 | |||
| Blackpool North and Cleveleys | LAN | NW | Con | Con | 22,364 | 57.6% | 8,596 | 60.9% | 22,364 | 13,768 | 1,494 | 735 | 443 | 38,804 | |||
| Blackpool South | LAN | NW | Lab | Con | 16,247 | 49.6% | 3,690 | 56.8% | 16,247 | 12,557 | 1,008 | 563 | 2,009 | 368 | 32,752 | ||
| Blaydon | TWR | NE | Lab | Lab | 19,794 | 43.3% | 5,531 | 67.3% | 14,263 | 19,794 | 3,703 | 1,279 | 5,883 | 2,088 | 45,681 | ||
| Blyth Valley | NBL | NE | Lab | Con | 17,440 | 42.7% | 712 | 64.6% | 17,440 | 16,728 | 2,151 | 1,146 | 3,394 | 40,859 | |||
| Bognor Regis and Littlehampton | WSX | SE | Con | Con | 32,521 | 63.5% | 22,503 | 66.1% | 32,521 | 10,018 | 5,645 | 1,826 | 1,213 | 51,223 | |||
| Bolsover | DBY | EM | Lab | Con | 21,791 | 47.4% | 5,299 | 61.1% | 21,791 | 16,492 | 1,759 | 758 | 4,151 | 987 | 45,938 | ||
| Bolton North East | GTM | NW | Lab | Con | 19,759 | 45.4% | 378 | 64.5% | 19,759 | 19,381 | 1,847 | 689 | 1,880 | 43,556 | |||
| Bolton South East | GTM | NW | Lab | Lab | 21,516 | 53.0% | 7,598 | 58.7% | 13,918 | 21,516 | 1,411 | 791 | 2,968 | 40,604 | |||
| Bolton West | GTM | NW | Con | Con | 27,255 | 55.3% | 8,885 | 67.4% | 27,255 | 18,400 | 2,704 | 939 | 49,298 | ||||
| Bootle | MSY | NW | Lab | Lab | 39,066 | 79.4% | 34,556 | 65.7% | 4,510 | 39,066 | 1,822 | 1,166 | 2,610 | 49,174 | |||
| Boston and Skegness | LIN | EM | Con | Con | 31,963 | 76.7% | 25,621 | 60.2% | 31,963 | 6,342 | 1,963 | 1,428 | 41,696 | ||||
| Bosworth | LEI | EM | Con | Con | 36,056 | 63.9% | 26,278 | 69.2% | 36,056 | 9,778 | 9,096 | 1,502 | 56,432 | ||||
| Bournemouth East | DOR | SW | Con | Con | 24,296 | 50.6% | 8,176 | 66.5% | 24,296 | 16,120 | 5,418 | 2,049 | 761 | 49,274 | |||
| Bournemouth West | DOR | SW | Con | Con | 24,550 | 53.4% | 10,150 | 62.0% | 24,550 | 14,400 | 4,931 | 2,096 | 45,977 | ||||
| Bracknell | BRK | SE | Con | Con | 31,894 | 58.7% | 19,829 | 68.6% | 31,894 | 12,065 | 7,749 | 2,089 | 553 | 54,350 | |||
| Bradford East | WYK | YTH | Lab | Lab | 27,825 | 63.0% | 18,144 | 60.4% | 9,681 | 27,825 | 3,316 | 662 | 2,700 | 44,184 | |||
| Bradford South | WYK | YTH | Lab | Lab | 18,390 | 46.3% | 2,346 | 57.6% | 16,044 | 18,390 | 1,505 | 983 | 2,819 | 39,741 | |||
| Bradford West | WYK | YTH | Lab | Lab | 33,736 | 76.2% | 27,019 | 62.6% | 6,717 | 33,736 | 1,349 | 813 | 1,556 | 90 | 44,261 | ||
| Braintree | ESS | E | Con | Con | 34,112 | 67.5% | 24,673 | 67.1% | 34,112 | 9,439 | 4,779 | 2,169 | 50,499 | ||||
| Brent Central | LND | LND | Lab | Lab | 31,779 | 64.7% | 20,870 | 58.3% | 10,909 | 31,779 | 4,844 | 1,600 | 49,132 | ||||
| Brent North | LND | LND | Lab | Lab | 26,911 | 51.9% | 8,079 | 61.9% | 18,832 | 26,911 | 4,065 | 850 | 951 | 270 | 51,879 | ||
| Brentford and Isleworth | LND | LND | Lab | Lab | 29,266 | 50.2% | 10,514 | 68.0% | 18,752 | 29,266 | 7,314 | 1,829 | 1,165 | 58,326 | |||
| Brentwood and Ongar | ESS | E | Con | Con | 36,308 | 68.6% | 29,065 | 70.4% | 36,308 | 7,243 | 7,187 | 1,671 | 532 | 52,941 | |||
| Bridgwater and West Somerset | SOM | SW | Con | Con | 35,827 | 62.1% | 24,439 | 67.9% | 35,827 | 11,388 | 7,805 | 1,877 | 755 | 57,652 | |||
| Brigg and Goole | HUM | YTH | Con | Con | 30,941 | 71.3% | 21,941 | 65.8% | 30,941 | 9,000 | 2,180 | 1,281 | 43,402 | ||||
| Brighton Kemptown | SXE | SE | Lab | Lab | 25,033 | 51.6% | 8,061 | 69.5% | 16,972 | 25,033 | 2,964 | 2,237 | 1,327 | 48,533 | |||
| Brighton Pavilion | SXE | SE | Grn | Grn | 33,151 | 57.2% | 19,940 | 73.4% | 10,176 | 13,211 | 33,151 | 770 | 690 | 57,998 | |||
| Bristol East | AVN | SW | Lab | Lab | 27,717 | 53.1% | 10,794 | 70.6% | 16,923 | 27,717 | 3,527 | 2,106 | 1,881 | 52,154 | |||
| Bristol North West | AVN | SW | Lab | Lab | 27,330 | 48.9% | 5,692 | 73.3% | 21,638 | 27,330 | 4,940 | 1,977 | 55,885 | ||||
| Bristol South | AVN | SW | Lab | Lab | 27,895 | 50.5% | 9,859 | 65.6% | 18,036 | 27,895 | 4,227 | 2,713 | 2,325 | 55,196 | |||
| Bristol West | AVN | SW | Lab | Lab | 47,028 | 62.3% | 28,219 | 76.1% | 8,822 | 47,028 | 18,809 | 869 | 75,528 | ||||
| Broadland | NFK | E | Con | Con | 33,934 | 59.6% | 21,861 | 72.9% | 33,934 | 12,073 | 9,195 | 1,412 | 363 | 56,977 | |||
| Bromley and Chislehurst | LND | LND | Con | Con | 23,958 | 52.6% | 10,891 | 68.3% | 23,958 | 13,067 | 6,621 | 1,546 | 374 | 45,566 | |||
| Bromsgrove | HWR | WM | Con | Con | 34,408 | 63.4% | 23,106 | 72.6% | 34,408 | 11,302 | 6,779 | 1,783 | 54,532 | ||||
| Broxbourne | HRT | E | Con | Con | 30,631 | 65.6% | 19,807 | 63.8% | 30,631 | 10,824 | 3,970 | 1,281 | 46,706 | ||||
| Broxtowe | NTT | EM | Con | Con | 26,602 | 48.1% | 5,331 | 75.7% | 26,602 | 21,271 | 1,806 | 5,593 | 55,272 | ||||
| Buckingham | BKM | SE | Spkr | Con | 37,035 | 58.4% | 20,411 | 76.3% | 37,035 | 7,638 | 16,624 | 1,286 | 875 | 63,458 | |||
| Burnley | LAN | NW | Lab | Con | 15,720 | 40.3% | 1,352 | 60.6% | 15,720 | 14,368 | 3,501 | 739 | 3,362 | 1,294 | 38,984 | ||
| Burton | STS | WM | Con | Con | 29,560 | 60.7% | 14,496 | 65.0% | 29,560 | 15,064 | 2,681 | 1,433 | 48,738 | ||||
| Bury North | GTM | NW | Lab | Con | 21,660 | 46.2% | 105 | 68.1% | 21,660 | 21,555 | 1,584 | 802 | 1,240 | 46,841 | |||
| Bury South | GTM | NW | Lab | Con | 22,034 | 43.8% | 402 | 66.9% | 22,034 | 21,632 | 2,315 | 848 | 1,672 | 1,773 | 50,274 | ||
| Bury St Edmunds | SFK | E | Con | Con | 37,770 | 61.0% | 24,988 | 69.1% | 37,770 | 12,782 | 9,711 | 1,694 | 61,957 | ||||
| Calder Valley | WYK | YTH | Con | Con | 29,981 | 51.9% | 5,774 | 72.9% | 29,981 | 24,207 | 2,884 | 721 | 57,793 | ||||
| Camberwell and Peckham | LND | LND | Lab | Lab | 40,258 | 71.3% | 33,780 | 63.4% | 6,478 | 40,258 | 5,087 | 3,501 | 1,041 | 127 | 56,492 | ||
| Camborne and Redruth | CUL | SW | Con | Con | 26,764 | 53.1% | 8,700 | 71.7% | 26,764 | 18,064 | 3,504 | 1,359 | 676 | 50,367 | |||
| Cambridge | CAM | E | Lab | Lab | 25,776 | 48.0% | 9,639 | 67.2% | 8,342 | 25,776 | 16,137 | 2,164 | 1,041 | 269 | 53,729 | ||
| Cannock Chase | STS | WM | Con | Con | 31,636 | 68.3% | 19,879 | 61.9% | 31,636 | 11,757 | 2,920 | 46,313 | |||||
| Canterbury | KEN | SE | Lab | Lab | 29,018 | 48.3% | 1,836 | 75.0% | 27,182 | 29,018 | 3,408 | 505 | 60,113 | ||||
| Carlisle | CMA | NW | Con | Con | 23,659 | 55.2% | 8,289 | 65.9% | 23,659 | 15,340 | 2,829 | 1,045 | 42,847 | ||||
| Carshalton and Wallington | LND | LND | LD | Con | 20,822 | 42.4% | 629 | 67.3% | 20,822 | 6,081 | 20,193 | 759 | 1,043 | 200 | 49,098 | ||
| Castle Point | ESS | E | Con | Con | 33,971 | 76.7% | 26,634 | 63.6% | 33,971 | 7,337 | 2,969 | 44,277 | |||||
| Central Devon | DEV | SW | Con | Con | 32,095 | 55.3% | 17,721 | 77.5% | 32,095 | 14,374 | 8,770 | 2,833 | 58,072 | ||||
| Central Suffolk and North Ipswich | SFK | E | Con | Con | 35,253 | 62.7% | 23,351 | 73.8% | 35,253 | 11,862 | 6,485 | 2,650 | 56,250 | ||||
| Charnwood | LEI | EM | Con | Con | 35,121 | 63.4% | 22,397 | 69.6% | 35,121 | 12,724 | 4,856 | 2,664 | 55,365 | ||||
| Chatham and Aylesford | KEN | SE | Con | Con | 28,856 | 66.6% | 18,540 | 59.1% | 28,856 | 10,316 | 2,866 | 1,090 | 212 | 43,340 | |||
| Cheadle | GTM | NW | Con | Con | 25,694 | 46.0% | 2,336 | 74.9% | 25,694 | 6,851 | 23,358 | 55,903 | |||||
| Chelmsford | ESS | E | Con | Con | 31,934 | 55.9% | 17,621 | 71.0% | 31,934 | 10,295 | 14,313 | 580 | 57,122 | ||||
| Chelsea and Fulham | LND | LND | Con | Con | 23,345 | 49.9% | 11,241 | 69.8% | 23,345 | 10,872 | 12,104 | 500 | 46,821 | ||||
| Cheltenham | GLS | SW | Con | Con | 28,486 | 48.0% | 981 | 73.2% | 28,486 | 2,921 | 27,505 | 445 | 59,357 | ||||
| Chesham and Amersham | BKM | SE | Con | Con | 30,850 | 55.4% | 16,223 | 76.8% | 30,850 | 7,166 | 14,627 | 3,042 | 55,685 | ||||
| Chesterfield | DBY | EM | Lab | Lab | 18,171 | 40.2% | 1,451 | 63.6% | 16,720 | 18,171 | 3,985 | 1,148 | 4,771 | 391 | 45,186 | ||
| Chichester | WSX | SE | Con | Con | 35,402 | 57.8% | 21,490 | 71.6% | 35,402 | 9,069 | 13,912 | 2,527 | 333 | 61,243 | |||
| Chingford and Woodford Green | LND | LND | Con | Con | 23,481 | 48.5% | 1,262 | 74.1% | 23,481 | 22,219 | 2,744 | 48,444 | |||||
| Chippenham | WIL | SW | Con | Con | 30,994 | 54.3% | 11,288 | 73.9% | 30,994 | 6,399 | 19,706 | 57,099 | |||||
| Chipping Barnet | LND | LND | Con | Con | 25,745 | 44.7% | 1,212 | 72.0% | 25,745 | 24,533 | 5,932 | 1,288 | 71 | 57,569 | |||
| Chorley | LAN | NW | Lab | Spkr | 26,831 | 67.3% | 17,392 | 51.0% | 3,600 | 36,270 | 39,870 | ||||||
| Christchurch | DOR | SW | Con | Con | 33,894 | 65.2% | 24,617 | 72.6% | 33,894 | 6,568 | 9,277 | 2,212 | 51,951 | ||||
| Cities of London and Westminster | LND | LND | Con | Con | 17,049 | 39.9% | 3,953 | 67.1% | 17,049 | 11,624 | 13,096 | 728 | 226 | 42,723 | |||
| City of Chester | CHS | NW | Lab | Lab | 27,082 | 49.6% | 6,164 | 71.7% | 20,918 | 27,082 | 3,734 | 1,438 | 1,388 | 54,560 | |||
| City of Durham | DUR | NE | Lab | Lab | 20,531 | 42.0% | 5,025 | 68.6% | 15,506 | 20,531 | 7,935 | 1,635 | 3,252 | 48,859 | |||
| Clacton | ESS | E | Con | Con | 31,438 | 72.3% | 24,702 | 61.3% | 31,438 | 6,736 | 2,541 | 1,225 | 1,566 | 43,506 | |||
| Cleethorpes | HUM | YTH | Con | Con | 31,969 | 69.0% | 21,418 | 62.9% | 31,969 | 10,551 | 2,535 | 1,284 | 46,339 | ||||
| Colchester | ESS | E | Con | Con | 26,917 | 50.4% | 9,423 | 64.6% | 26,917 | 17,494 | 7,432 | 1,530 | 53,373 | ||||
| Colne Valley | WYK | YTH | Lab | Con | 29,482 | 48.4% | 5,103 | 72.4% | 29,482 | 24,379 | 3,815 | 1,068 | 1,286 | 880 | 60,910 | ||
| Congleton | CHS | NW | Con | Con | 33,747 | 59.0% | 18,561 | 70.7% | 33,747 | 15,186 | 6,026 | 1,616 | 658 | 57,233 | |||
| Copeland | CMA | NW | Con | Con | 22,856 | 53.7% | 5,842 | 68.9% | 22,856 | 17,014 | 1,888 | 765 | 42,523 | ||||
| Corby | NTH | EM | Con | Con | 33,410 | 55.2% | 10,268 | 70.2% | 33,410 | 23,142 | 3,932 | 60,484 | |||||
| Coventry North East | WMD | WM | Lab | Lab | 23,412 | 52.7% | 7,692 | 58.5% | 15,720 | 23,412 | 2,061 | 1,141 | 2,110 | 44,444 | |||
| Coventry North West | WMD | WM | Lab | Lab | 20,918 | 43.8% | 208 | 63.5% | 20,710 | 20,918 | 2,717 | 1,443 | 1,956 | 47,744 | |||
| Coventry South | WMD | WM | Lab | Lab | 19,544 | 43.4% | 401 | 63.5% | 19,143 | 19,544 | 3,398 | 1,092 | 1,432 | 435 | 45,044 | ||
| Crawley | WSX | SE | Con | Con | 27,040 | 54.2% | 8,360 | 67.2% | 27,040 | 18,680 | 2,728 | 1,451 | 49,899 | ||||
| Crewe and Nantwich | CHS | NW | Lab | Con | 28,704 | 53.1% | 8,508 | 67.3% | 28,704 | 20,196 | 2,618 | 975 | 1,390 | 149 | 54,032 | ||
| Croydon Central | LND | LND | Lab | Lab | 27,124 | 50.2% | 5,949 | 66.4% | 21,175 | 27,124 | 3,532 | 1,215 | 999 | 54,045 | |||
| Croydon North | LND | LND | Lab | Lab | 36,495 | 65.6% | 24,673 | 62.9% | 11,822 | 36,495 | 4,476 | 1,629 | 839 | 348 | 55,609 | ||
| Croydon South | LND | LND | Con | Con | 30,985 | 52.2% | 12,339 | 70.7% | 30,985 | 18,646 | 7,503 | 1,782 | 442 | 59,358 | |||
| Dagenham and Rainham | LND | LND | Lab | Lab | 19,468 | 45.5% | 293 | 61.6% | 19,175 | 19,468 | 1,182 | 602 | 2,887 | 411 | 43,725 | ||
| Darlington | DUR | NE | Lab | Con | 20,901 | 48.1% | 3,294 | 65.5% | 20,901 | 17,607 | 2,097 | 1,057 | 1,544 | 292 | 43,498 | ||
| Dartford | KEN | SE | Con | Con | 34,006 | 62.9% | 19,160 | 65.7% | 34,006 | 14,846 | 3,735 | 1,435 | 54,022 | ||||
| Daventry | NTH | EM | Con | Con | 37,055 | 64.6% | 26,080 | 74.0% | 37,055 | 10,975 | 7,032 | 2,341 | 57,403 | ||||
| Denton and Reddish | GTM | NW | Lab | Lab | 19,317 | 50.1% | 6,175 | 58.3% | 13,142 | 19,317 | 1,642 | 1,124 | 3,039 | 324 | 38,588 | ||
| Derby North | DBY | EM | Lab | Con | 21,259 | 45.2% | 2,540 | 64.2% | 21,259 | 18,719 | 3,450 | 1,046 | 1,908 | 635 | 47,014 | ||
| Derby South | DBY | EM | Lab | Lab | 21,690 | 51.1% | 6,019 | 58.1% | 15,671 | 21,690 | 2,621 | 2,480 | 42,462 | ||||
| Derbyshire Dales | DBY | EM | Con | Con | 29,356 | 58.7% | 17,381 | 76.9% | 29,356 | 11,975 | 6,627 | 2,058 | 50,016 | ||||
| Devizes | WIL | SW | Con | Con | 32,150 | 63.1% | 23,993 | 69.4% | 32,150 | 7,838 | 8,157 | 2,809 | 50,954 | ||||
| Dewsbury | WYK | YTH | Lab | Con | 26,179 | 46.4% | 1,561 | 69.4% | 26,179 | 24,618 | 2,406 | 1,060 | 1,874 | 252 | 56,389 | ||
| Don Valley | SYK | YTH | Lab | Con | 19,609 | 43.2% | 3,630 | 60.3% | 19,609 | 15,979 | 1,907 | 872 | 6,247 | 823 | 45,437 | ||
| Doncaster Central | SYK | YTH | Lab | Lab | 16,638 | 40.0% | 2,278 | 58.2% | 14,360 | 16,638 | 1,748 | 981 | 6,842 | 1,012 | 41,581 | ||
| Doncaster North | SYK | YTH | Lab | Lab | 15,740 | 38.7% | 2,370 | 56.2% | 13,370 | 15,740 | 1,476 | 8,294 | 1,818 | 40,698 | |||
| Dover | KEN | SE | Con | Con | 28,830 | 56.9% | 12,278 | 66.4% | 28,830 | 16,552 | 2,895 | 1,371 | 1,053 | 50,701 | |||
| Dudley North | WMD | WM | Lab | Con | 23,134 | 63.1% | 11,533 | 59.2% | 23,134 | 11,601 | 1,210 | 739 | 36,684 | ||||
| Dudley South | WMD | WM | Con | Con | 24,832 | 67.9% | 15,565 | 60.2% | 24,835 | 9,270 | 1,608 | 863 | 36,576 | ||||
| Dulwich and West Norwood | LND | LND | Lab | Lab | 36,521 | 65.5% | 27,310 | 65.9% | 9,160 | 36,521 | 9,211 | 571 | 315 | 55,778 | |||
| Ealing Central and Acton | LND | LND | Lab | Lab | 28,132 | 51.3% | 13,300 | 72.6% | 14,832 | 28,132 | 9,444 | 1,735 | 664 | 55,342 | |||
| Ealing North | LND | LND | Lab | Lab | 28,036 | 56.5% | 12,269 | 66.6% | 15,767 | 28,036 | 4,370 | 1,458 | 49,631 | ||||
| Ealing Southall | LND | LND | Lab | Lab | 25,678 | 60.8% | 16,084 | 65.4% | 9,594 | 25,678 | 3,933 | 1,688 | 867 | 457 | 42,217 | ||
| Easington | DUR | NE | Lab | Lab | 15,723 | 45.5% | 6,581 | 56.5% | 9,142 | 15,723 | 1,526 | 6,744 | 1,448 | 34,583 | |||
| East Devon | DEV | SW | Con | Con | 32,577 | 50.8% | 6,708 | 73.6% | 32,577 | 2,870 | 1,771 | 711 | 26,144 | 64,233 | |||
| East Ham | LND | LND | Lab | Lab | 41,703 | 76.3% | 33,176 | 60.7% | 8,527 | 41,703 | 2,158 | 883 | 1,107 | 250 | 54,628 | ||
| East Hampshire | HAM | SE | Con | Con | 33,446 | 58.8% | 19,696 | 74.4% | 33,446 | 6,287 | 13,750 | 2,600 | 812 | 56,895 | |||
| East Surrey | SRY | SE | Con | Con | 35,624 | 59.7% | 24,040 | 72.1% | 35,624 | 8,247 | 11,584 | 2,340 | 1,895 | 59,925 | |||
| East Worthing and Shoreham | WSX | SE | Con | Con | 27,104 | 51.0% | 7,441 | 70.7% | 27,104 | 19,663 | 4,127 | 2,006 | 255 | 53,155 | |||
| East Yorkshire | HUM | YTH | Con | Con | 33,998 | 64.4% | 22,787 | 65.3% | 33,998 | 11,201 | 4,219 | 1,675 | 1,686 | 52,779 | |||
| Eastbourne | SXE | SE | LD | Con | 26,951 | 48.9% | 4,331 | 69.5% | 26,951 | 3,848 | 22,620 | 1,530 | 185 | 55,134 | |||
| Eastleigh | HAM | SE | Con | Con | 32,690 | 55.4% | 15,607 | 70.3% | 32,690 | 7,559 | 17,083 | 1,639 | 58,971 | ||||
| Eddisbury | CHS | NW | Con | Con | 30,095 | 56.8% | 18,443 | 71.9% | 30,095 | 11,652 | 9,582 | 1,191 | 451 | 53,114 | |||
| Edmonton | LND | LND | Lab | Lab | 26,217 | 65.0% | 16,015 | 61.5% | 10,202 | 26,217 | 2,145 | 862 | 840 | 75 | 40,341 | ||
| Ellesmere Port and Neston | CHS | NW | Lab | Lab | 26,001 | 53.3% | 8,764 | 69.3% | 17,237 | 26,001 | 2,406 | 964 | 2,138 | 46,340 | |||
| Elmet and Rothwell | WYK | YTH | Con | Con | 33,726 | 57.9% | 17,353 | 71.9% | 33,726 | 16,373 | 5,155 | 1,775 | 1,196 | 58,225 | |||
| Eltham | LND | LND | Lab | Lab | 20,550 | 47.0% | 3,197 | 68.2% | 17,353 | 20,550 | 2,941 | 1,322 | 1,523 | 43,689 | |||
| Enfield North | LND | LND | Lab | Lab | 23,340 | 51.8% | 6,492 | 66.0% | 16,848 | 23,340 | 2,950 | 1,115 | 797 | 45,050 | |||
| Enfield Southgate | LND | LND | Lab | Lab | 22,923 | 48.5% | 4,450 | 72.1% | 18,473 | 22,923 | 4,344 | 1,042 | 494 | 47,276 | |||
| Epping Forest | ESS | E | Con | Con | 32,364 | 64.4% | 22,173 | 67.7% | 32,364 | 10,191 | 5,387 | 1,975 | 351 | 50,268 | |||
| Epsom and Ewell | SRY | SE | Con | Con | 31,819 | 53.5% | 17,873 | 73.3% | 31,819 | 10,226 | 13,946 | 2,047 | 1,413 | 59,451 | |||
| Erewash | DBY | EM | Con | Con | 27,560 | 56.5% | 10,606 | 67.3% | 27,560 | 16,954 | 2,487 | 1,115 | 698 | 48,814 | |||
| Erith and Thamesmead | LND | LND | Lab | Lab | 19,882 | 48.0% | 3,758 | 63.3% | 16,124 | 19,882 | 1,986 | 876 | 2,246 | 272 | 41,284 | ||
| Esher and Walton | SRY | SE | Con | Con | 31,132 | 49.4% | 2,743 | 77.7% | 31,132 | 2,838 | 28,389 | 705 | 63,084 | ||||
| Exeter | DEV | SW | Lab | Lab | 29,882 | 53.2% | 10,403 | 68.5% | 19,479 | 29,882 | 4,838 | 1,428 | 565 | 56,192 | |||
| Fareham | HAM | SE | Con | Con | 36,459 | 63.7% | 26,086 | 73.1% | 36,459 | 10,373 | 8,006 | 2,412 | 57,250 | ||||
| Faversham and Mid Kent | KEN | SE | Con | Con | 31,864 | 63.2% | 21,976 | 68.7% | 31,864 | 9,888 | 6,170 | 2,103 | 369 | 50,394 | |||
| Feltham and Heston | LND | LND | Lab | Lab | 24,876 | 52.0% | 7,859 | 59.1% | 17,017 | 24,876 | 3,127 | 1,133 | 1,658 | 47,811 | |||
| Filton and Bradley Stoke | AVN | SW | Con | Con | 26,293 | 48.9% | 5,646 | 72.6% | 26,293 | 20,647 | 4,992 | 1,563 | 257 | 53,752 | |||
| Finchley and Golders Green | LND | LND | Con | Con | 24,162 | 43.8% | 6,562 | 71.0% | 24,162 | 13,347 | 17,600 | 55,109 | |||||
| Folkestone and Hythe | KEN | SE | Con | Con | 35,483 | 60.1% | 21,337 | 66.8% | 35,483 | 14,146 | 5,755 | 2,706 | 915 | 59,005 | |||
| Forest of Dean | GLS | SW | Con | Con | 30,680 | 59.6% | 15,869 | 72.1% | 30,680 | 14,811 | 4,681 | 1,303 | 51,475 | ||||
| Fylde | LAN | NW | Con | Con | 28,432 | 60.9% | 16,611 | 69.8% | 28,432 | 11,821 | 3,748 | 1,731 | 927 | 46,659 | |||
| Gainsborough | LIN | EM | Con | Con | 33,893 | 66.4% | 22,967 | 66.9% | 33,893 | 10,926 | 5,157 | 1,070 | 51,046 | ||||
| Garston and Halewood | MSY | NW | Lab | Lab | 38,578 | 72.3% | 31,624 | 70.1% | 6,954 | 38,578 | 3,324 | 1,183 | 2,943 | 344 | 53,326 | ||
| Gateshead | TWR | NE | Lab | Lab | 20,450 | 53.6% | 7,200 | 59.2% | 13,250 | 20,450 | 2,792 | 1,653 | 38,145 | ||||
| Gedling | NTT | EM | Lab | Con | 22,718 | 45.5% | 679 | 69.9% | 22,718 | 22,039 | 2,279 | 1,097 | 1,820 | 49,953 | |||
| Gillingham and Rainham | KEN | SE | Con | Con | 28,173 | 61.3% | 15,119 | 62.5% | 28,173 | 13,054 | 2,503 | 1,043 | 1,185 | 45,958 | |||
| Gloucester | GLS | SW | Con | Con | 29,159 | 54.2% | 10,277 | 66.1% | 29,159 | 18,882 | 4,338 | 1,385 | 53,764 | ||||
| Gosport | HAM | SE | Con | Con | 32,226 | 66.5% | 23,278 | 65.9% | 32,226 | 8,948 | 5,473 | 1,806 | 48,453 | ||||
| Grantham and Stamford | LIN | EM | Con | Con | 36,794 | 65.7% | 26,003 | 68.7% | 36,794 | 10,791 | 6,153 | 2,265 | 56,003 | ||||
| Gravesham | KEN | SE | Con | Con | 29,580 | 62.2% | 15,581 | 64.9% | 29,580 | 13,999 | 2,584 | 1,397 | 47,560 | ||||
| Great Grimsby | HUM | YTH | Lab | Con | 18,150 | 54.9% | 7,331 | 53.9% | 18,150 | 10,819 | 1,070 | 514 | 2,378 | 156 | 33,087 | ||
| Great Yarmouth | NFK | E | Con | Con | 28,593 | 65.8% | 17,663 | 60.4% | 28,593 | 10,930 | 1,661 | 1,064 | 1,214 | 43,462 | |||
| Greenwich and Woolwich | LND | LND | Lab | Lab | 30,185 | 56.8% | 18,464 | 66.4% | 11,721 | 30,185 | 7,253 | 2,363 | 1,228 | 370 | 53,120 | ||
| Guildford | SRY | SE | Con | Con | 26,317 | 44.9% | 3,337 | 75.5% | 26,317 | 4,515 | 22,980 | 4,839 | 58,651 | ||||
| Hackney North and Stoke Newington | LND | LND | Lab | Lab | 39,972 | 70.3% | 33,188 | 61.5% | 6,784 | 39,972 | 4,283 | 4,989 | 609 | 227 | 56,864 | ||
| Hackney South and Shoreditch | LND | LND | Lab | Lab | 39,884 | 73.3% | 33,985 | 60.9% | 5,899 | 39,884 | 4,853 | 2,948 | 744 | 111 | 54,439 | ||
| Halesowen and Rowley Regis | WMD | WM | Con | Con | 25,607 | 60.5% | 12,074 | 62.0% | 25,607 | 13,533 | 1,738 | 934 | 533 | 42,345 | |||
| Halifax | WYK | YTH | Lab | Lab | 21,496 | 46.3% | 2,569 | 64.6% | 18,927 | 21,496 | 2,276 | 946 | 2,813 | 46,458 | |||
| Haltemprice and Howden | HUM | YTH | Con | Con | 31,045 | 62.4% | 20,329 | 70.0% | 31,045 | 10,716 | 5,215 | 1,764 | 1,039 | 49,779 | |||
| Halton | CHS | NW | Lab | Lab | 29,333 | 63.5% | 18,975 | 64.2% | 10,358 | 29,333 | 1,800 | 982 | 3,730 | 46,203 | |||
| Hammersmith | LND | LND | Lab | Lab | 30,074 | 57.9% | 17,847 | 69.5% | 12,227 | 30,074 | 6,947 | 1,744 | 974 | 51,966 | |||
| Hampstead and Kilburn | LND | LND | Lab | Lab | 28,080 | 48.9% | 14,188 | 66.3% | 13,892 | 28,080 | 13,121 | 1,608 | 684 | 57,385 | |||
| Harborough | LEI | EM | Con | Con | 31,698 | 55.3% | 17,278 | 71.5% | 31,698 | 14,420 | 9,103 | 1,709 | 389 | 57,319 | |||
| Harlow | ESS | E | Con | Con | 27,510 | 63.5% | 14,063 | 63.7% | 27,510 | 13,447 | 2,397 | 43,354 | |||||
| Harrogate and Knaresborough | NYK | YTH | Con | Con | 29,962 | 52.6% | 9,675 | 73.1% | 29,962 | 5,480 | 20,287 | 1,208 | 56,937 | ||||
| Harrow East | LND | LND | Con | Con | 26,935 | 54.4% | 8,170 | 68.6% | 26,935 | 18,765 | 3,791 | 49,491 | |||||
| Harrow West | LND | LND | Lab | Lab | 25,132 | 52.4% | 8,692 | 66.1% | 16,440 | 25,132 | 4,310 | 1,109 | 931 | 47,922 | |||
| Hartlepool | CLV | NE | Lab | Lab | 15,464 | 37.7% | 3,595 | 57.9% | 11,869 | 15,464 | 1,696 | 10,603 | 1,405 | 41,037 | |||
| Harwich and North Essex | ESS | E | Con | Con | 31,830 | 61.3% | 20,182 | 70.1% | 31,830 | 11,648 | 5,866 | 1,945 | 674 | 51,963 | |||
| Hastings and Rye | SXE | SE | Con | Con | 26,896 | 49.6% | 4,043 | 67.4% | 26,896 | 22,853 | 3,960 | 565 | 54,274 | ||||
| Havant | HAM | SE | Con | Con | 30,051 | 65.4% | 21,792 | 63.7% | 30,051 | 8,259 | 5,708 | 1,597 | 344 | 45,959 | |||
| Hayes and Harlington | LND | LND | Lab | Lab | 24,545 | 55.8% | 9,261 | 60.8% | 15,284 | 24,545 | 1,947 | 739 | 1,292 | 187 | 43,994 | ||
| Hazel Grove | GTM | NW | Con | Con | 21,592 | 48.8% | 4,423 | 69.9% | 21,592 | 5,508 | 17,169 | 44,269 | |||||
| Hemel Hempstead | HRT | E | Con | Con | 28,968 | 56.5% | 14,563 | 69.5% | 28,968 | 14,405 | 6,317 | 1,581 | 51,271 | ||||
| Hemsworth | WYK | YTH | Lab | Lab | 16,460 | 37.5% | 1,180 | 59.6% | 15,280 | 16,460 | 1,734 | 916 | 5,930 | 3,587 | 43,907 | ||
| Hendon | LND | LND | Con | Con | 26,878 | 48.8% | 4,230 | 66.6% | 26,878 | 22,648 | 4,628 | 921 | 55,075 | ||||
| Henley | OXF | SE | Con | Con | 32,189 | 54.8% | 14,053 | 76.6% | 32,189 | 5,698 | 18,136 | 2,736 | 58,759 | ||||
| Hereford and South Herefordshire | HWR | WM | Con | Con | 30,390 | 61.2% | 19,686 | 68.9% | 30,390 | 10,704 | 6,181 | 2,371 | 49,646 | ||||
| Hertford and Stortford | HRT | E | Con | Con | 33,712 | 56.1% | 19,620 | 72.9% | 33,712 | 14,092 | 8,596 | 2,705 | 989 | 60,094 | |||
| Hertsmere | HRT | E | Con | Con | 32,651 | 62.5% | 21,313 | 70.6% | 32,651 | 11,338 | 6,561 | 1,653 | 52,203 | ||||
| Hexham | NBL | NE | Con | Con | 25,152 | 54.5% | 10,549 | 75.3% | 25,152 | 14,603 | 4,672 | 1,723 | 46,150 | ||||
| Heywood and Middleton | GTM | NW | Lab | Con | 20,453 | 43.1% | 663 | 59.2% | 20,453 | 19,790 | 2,073 | 1,220 | 3,952 | 47,488 | |||
| High Peak | DBY | EM | Lab | Con | 24,844 | 45.9% | 590 | 72.9% | 24,844 | 24,254 | 2,750 | 1,148 | 1,177 | 54,173 | |||
| Hitchin and Harpenden | HRT | E | Con | Con | 27,719 | 47.1% | 6,895 | 77.1% | 27,719 | 9,959 | 20,824 | 369 | 58,871 | ||||
| Holborn and St Pancras | LND | LND | Lab | Lab | 36,641 | 64.5% | 27,673 | 65.1% | 8,878 | 36,641 | 7,314 | 2,746 | 1,032 | 175 | 56,786 | ||
| Hornchurch and Upminster | LND | LND | Con | Con | 35,495 | 65.8% | 23,308 | 66.8% | 35,495 | 12,187 | 3,862 | 1,920 | 510 | 53,974 | |||
| Hornsey and Wood Green | LND | LND | Lab | Lab | 35,126 | 57.5% | 19,242 | 74.7% | 6,829 | 35,126 | 15,884 | 2,192 | 763 | 311 | 61,105 | ||
| Horsham | WSX | SE | Con | Con | 35,900 | 56.8% | 21,127 | 72.9% | 35,900 | 9,424 | 14,773 | 2,668 | 437 | 63,202 | |||
| Houghton and Sunderland South | TWR | NE | Lab | Lab | 16,210 | 40.7% | 3,115 | 57.8% | 13,095 | 16,210 | 2,319 | 1,125 | 6,165 | 897 | 39,811 | ||
| Hove | SXE | SE | Lab | Lab | 32,876 | 58.3% | 17,044 | 75.9% | 15,832 | 32,876 | 3,731 | 2,496 | 1,111 | 345 | 56,391 | ||
| Huddersfield | WYK | YTH | Lab | Lab | 20,509 | 49.0% | 4,937 | 63.9% | 15,572 | 20,509 | 2,367 | 1,768 | 1,666 | 41,882 | |||
| Huntingdon | CAM | E | Con | Con | 32,386 | 54.8% | 19,383 | 69.9% | 32,386 | 13,003 | 9,432 | 2,233 | 2,093 | 59,147 | |||
| Hyndburn | LAN | NW | Lab | Con | 20,565 | 48.5% | 2,951 | 59.8% | 20,565 | 17,614 | 1,226 | 845 | 2,156 | 42,406 | |||
| Ilford North | LND | LND | Lab | Lab | 25,323 | 50.5% | 5,218 | 68.7% | 20,125 | 25,323 | 2,680 | 845 | 960 | 201 | 50,114 | ||
| Ilford South | LND | LND | Lab | Lab | 35,085 | 65.6% | 24,101 | 62.9% | 10,984 | 35,085 | 1,795 | 714 | 1,008 | 3,891 | 53,477 | ||
| Ipswich | SFK | E | Lab | Con | 24,952 | 50.3% | 5,479 | 65.6% | 24,952 | 19,473 | 2,439 | 1,283 | 1,432 | 49,579 | |||
| Isle of Wight | IOW | SE | Con | Con | 41,815 | 56.2% | 23,737 | 65.9% | 41,815 | 18,078 | 11,338 | 3,211 | 74,442 | ||||
| Islington North | LND | LND | Lab | Lab | 34,603 | 64.3% | 26,188 | 71.6% | 5,483 | 34,603 | 8,415 | 4,326 | 742 | 236 | 53,805 | ||
| Islington South and Finsbury | LND | LND | Lab | Lab | 26,897 | 56.3% | 17,328 | 67.8% | 8,045 | 26,897 | 9,569 | 1,987 | 1,136 | 182 | 47,816 | ||
| Jarrow | TWR | NE | Lab | Lab | 18,363 | 45.1% | 7,120 | 62.6% | 11,243 | 18,363 | 2,360 | 831 | 4,122 | 3,817 | 40,736 | ||
| Keighley | WYK | YTH | Lab | Con | 25,298 | 48.1% | 2,218 | 72.3% | 25,298 | 23,080 | 2,573 | 850 | 799 | 52,600 | |||
| Kenilworth and Southam | WAR | WM | Con | Con | 30,351 | 57.7% | 20,353 | 77.2% | 30,351 | 9,440 | 9,998 | 2,351 | 457 | 52,597 | |||
| Kensington | LND | LND | Lab | Con | 16,768 | 38.3% | 150 | 67.7% | 16,768 | 16,618 | 9,312 | 535 | 384 | 145 | 43,762 | ||
| Kettering | NTH | EM | Con | Con | 29,787 | 60.3% | 16,765 | 67.5% | 29,787 | 13,022 | 3,367 | 1,543 | 1,642 | 49,361 | |||
| Kingston and Surbiton | LND | LND | LD | LD | 31,103 | 51.1% | 16,698 | 74.2% | 20,614 | 6,528 | 31,103 | 1,038 | 788 | 775 | 60,846 | ||
| Kingston upon Hull East | HUM | YTH | Lab | Lab | 12,713 | 39.2% | 1,239 | 49.3% | 11,474 | 12,713 | 1,707 | 784 | 5,764 | 32,442 | |||
| Kingston upon Hull North | HUM | YTH | Lab | Lab | 17,033 | 49.8% | 7,593 | 52.2% | 9,440 | 17,033 | 2,084 | 875 | 4,771 | 34,203 | |||
| Kingston upon Hull West and Hessle | HUM | YTH | Lab | Lab | 13,384 | 42.7% | 2,856 | 52.1% | 10,528 | 13,384 | 1,756 | 560 | 5,638 | 31,356 | |||
| Kingswood | AVN | SW | Con | Con | 27,712 | 56.2% | 11,220 | 71.5% | 27,712 | 16,492 | 3,421 | 1,200 | 489 | 49,314 | |||
| Knowsley | MSY | NW | Lab | Lab | 44,374 | 80.8% | 39,942 | 65.3% | 4,432 | 44,374 | 1,117 | 1,262 | 3,348 | 405 | 54,938 | ||
| Lancaster and Fleetwood | LAN | NW | Lab | Lab | 21,184 | 46.8% | 2,380 | 64.5% | 18,804 | 21,184 | 2,018 | 1,396 | 1,817 | 45,219 | |||
| Leeds Central | WYK | YTH | Lab | Lab | 30,413 | 61.7% | 19,270 | 54.2% | 11,143 | 30,413 | 2,343 | 2,105 | 2,999 | 281 | 49,284 | ||
| Leeds East | WYK | YTH | Lab | Lab | 19,464 | 49.8% | 5,531 | 58.0% | 13,933 | 19,464 | 1,796 | 878 | 2,981 | 39,052 | |||
| Leeds North East | WYK | YTH | Lab | Lab | 29,024 | 57.5% | 17,089 | 71.6% | 11,935 | 29,024 | 5,665 | 1,931 | 1,769 | 176 | 50,500 | ||
| Leeds North West | WYK | YTH | Lab | Lab | 23,971 | 48.6% | 10,749 | 72.8% | 13,222 | 23,971 | 9,397 | 1,389 | 1,304 | 49,283 | |||
| Leeds West | WYK | YTH | Lab | Lab | 22,186 | 55.1% | 10,564 | 59.5% | 11,622 | 22,186 | 1,787 | 1,274 | 2,685 | 727 | 40,281 | ||
| Leicester East | LEI | EM | Lab | Lab | 25,090 | 50.8% | 6,019 | 63.0% | 19,071 | 25,090 | 2,800 | 888 | 1,243 | 329 | 49,421 | ||
| Leicester South | LEI | EM | Lab | Lab | 33,606 | 67.0% | 22,675 | 64.5% | 10,931 | 33,606 | 2,754 | 1,669 | 1,187 | 50,147 | |||
| Leicester West | LEI | EM | Lab | Lab | 17,291 | 49.7% | 4,212 | 53.5% | 13,079 | 17,291 | 1,808 | 977 | 1,620 | 34,775 | |||
| Leigh | GTM | NW | Lab | Con | 21,266 | 45.3% | 1,965 | 60.7% | 21,266 | 19,301 | 2,252 | 3,161 | 999 | 46,979 | |||
| Lewes | SXE | SE | Con | Con | 26,268 | 47.9% | 2,457 | 76.7% | 26,268 | 3,206 | 23,811 | 1,453 | 113 | 54,851 | |||
| Lewisham Deptford | LND | LND | Lab | Lab | 39,216 | 70.8% | 32,913 | 68.7% | 6,303 | 39,216 | 5,774 | 3,085 | 789 | 201 | 55,368 | ||
| Lewisham East | LND | LND | Lab | Lab | 26,661 | 59.5% | 17,008 | 66.0% | 9,653 | 26,661 | 5,039 | 1,706 | 1,234 | 522 | 44,815 | ||
| Lewisham West and Penge | LND | LND | Lab | Lab | 31,860 | 61.2% | 21,543 | 69.8% | 10,317 | 31,860 | 6,260 | 2,390 | 1,060 | 213 | 52,100 | ||
| Leyton and Wanstead | LND | LND | Lab | Lab | 28,836 | 64.7% | 20,808 | 68.7% | 8,028 | 28,836 | 4,666 | 1,805 | 785 | 427 | 44,547 | ||
| Lichfield | STS | WM | Con | Con | 34,844 | 64.5% | 23,638 | 70.5% | 34,844 | 11,206 | 5,632 | 1,743 | 568 | 53,993 | |||
| Lincoln | LIN | EM | Lab | Con | 24,267 | 47.9% | 3,514 | 67.6% | 24,267 | 20,753 | 2,422 | 1,195 | 1,079 | 913 | 50,629 | ||
| Liverpool Riverside | MSY | NW | Lab | Lab | 41,170 | 78.0% | 37,043 | 65.7% | 4,127 | 41,170 | 2,696 | 3,017 | 1,779 | 52,789 | |||
| Liverpool Walton | MSY | NW | Lab | Lab | 34,538 | 84.7% | 30,520 | 65.1% | 4,018 | 34,538 | 756 | 814 | 660 | 40,786 | |||
| Liverpool Wavertree | MSY | NW | Lab | Lab | 31,310 | 72.2% | 27,085 | 68.4% | 4,225 | 31,310 | 4,055 | 1,365 | 1,921 | 501 | 43,377 | ||
| Liverpool West Derby | MSY | NW | Lab | Lab | 34,117 | 77.6% | 29,984 | 67.0% | 4,133 | 34,117 | 1,296 | 605 | 2,012 | 1,826 | 43,989 | ||
| Loughborough | LEI | EM | Con | Con | 27,954 | 51.2% | 7,169 | 68.5% | 27,954 | 20,785 | 4,153 | 1,504 | 235 | 54,631 | |||
| Louth and Horncastle | LIN | EM | Con | Con | 38,021 | 72.7% | 28,868 | 65.7% | 38,021 | 9,153 | 4,114 | 1,044 | 52,332 | ||||
| Ludlow | SAL | WM | Con | Con | 32,185 | 64.1% | 23,648 | 72.3% | 32,185 | 7,591 | 8,537 | 1,912 | 50,225 | ||||
| Luton North | BDF | E | Lab | Lab | 23,496 | 55.2% | 9,247 | 62.5% | 14,249 | 23,496 | 2,063 | 771 | 1,215 | 795 | 42,589 | ||
| Luton South | BDF | E | Lab | Lab | 21,787 | 51.8% | 8,756 | 60.7% | 13,031 | 21,787 | 995 | 1,601 | 4,650 | 42,064 | |||
| Macclesfield | CHS | NW | Con | Con | 28,292 | 52.5% | 10,711 | 70.7% | 28,292 | 17,581 | 5,684 | 2,310 | 53,867 | ||||
| Maidenhead | BRK | SE | Con | Con | 32,620 | 57.7% | 18,846 | 73.7% | 32,620 | 7,882 | 13,774 | 2,216 | 56,492 | ||||
| Maidstone and The Weald | KEN | SE | Con | Con | 31,220 | 60.4% | 21,771 | 67.9% | 31,220 | 9,448 | 8,482 | 2,172 | 358 | 51,680 | |||
| Makerfield | GTM | NW | Lab | Lab | 19,954 | 45.1% | 4,740 | 59.7% | 15,214 | 19,954 | 2,108 | 1,166 | 5,817 | 44,259 | |||
| Maldon | ESS | E | Con | Con | 36,304 | 72.0% | 30,041 | 69.6% | 36,304 | 6,263 | 5,990 | 1,851 | 50,408 | ||||
| Manchester Central | GTM | NW | Lab | Lab | 36,823 | 70.4% | 29,089 | 56.7% | 7,734 | 36,823 | 3,420 | 1,870 | 2,335 | 107 | 52,289 | ||
| Manchester Gorton | GTM | NW | Lab | Lab | 34,583 | 77.6% | 30,339 | 58.3% | 4,244 | 34,583 | 2,448 | 1,697 | 1,573 | 44,545 | |||
| Manchester Withington | GTM | NW | Lab | Lab | 35,902 | 67.7% | 27,905 | 69.2% | 5,820 | 35,902 | 7,997 | 1,968 | 1,308 | 52,995 | |||
| Mansfield | NTT | EM | Con | Con | 31,484 | 63.9% | 16,306 | 63.9% | 31,484 | 15,178 | 1,626 | 985 | 49,273 | ||||
| Meon Valley | HAM | SE | Con | Con | 35,271 | 63.5% | 23,555 | 73.4% | 35,271 | 5,644 | 11,716 | 2,198 | 55,569 | ||||
| Meriden | WMD | WM | Con | Con | 34,358 | 63.4% | 22,836 | 63.4% | 34,358 | 11,522 | 5,614 | 2,667 | 54,161 | ||||
| Mid Bedfordshire | BDF | E | Con | Con | 38,692 | 59.8% | 24,664 | 73.7% | 38,692 | 14,028 | 8,171 | 2,478 | 1,348 | 64,717 | |||
| Mid Derbyshire | DBY | EM | Con | Con | 29,027 | 58.8% | 15,385 | 73.2% | 29,027 | 13,642 | 4,756 | 1,931 | 49,356 | ||||
| Mid Dorset and North Poole | DOR | SW | Con | Con | 29,548 | 60.4% | 14,898 | 74.8% | 29,548 | 3,402 | 14,650 | 1,330 | 48,930 | ||||
| Mid Norfolk | NFK | E | Con | Con | 35,051 | 62.4% | 22,594 | 68.4% | 35,051 | 12,457 | 7,739 | 939 | 56,186 | ||||
| Mid Sussex | WSX | SE | Con | Con | 33,455 | 53.3% | 18,197 | 73.7% | 33,455 | 11,218 | 15,258 | 2,234 | 597 | 62,762 | |||
| Mid Worcestershire | HWR | WM | Con | Con | 37,426 | 66.7% | 28,108 | 71.8% | 37,426 | 9,408 | 6,474 | 2,177 | 638 | 56,123 | |||
| Middlesbrough | CLV | NE | Lab | Lab | 17,207 | 50.5% | 8,395 | 56.1% | 8,812 | 17,207 | 816 | 546 | 2,168 | 4,548 | 34,097 | ||
| Middlesbrough South and East Cleveland | CLV | NE | Con | Con | 28,135 | 58.8% | 11,626 | 66.1% | 28,135 | 16,509 | 1,953 | 1,220 | 47,817 | ||||
| Milton Keynes North | BKM | SE | Con | Con | 30,938 | 49.5% | 6,255 | 68.3% | 30,938 | 24,683 | 4,991 | 1,931 | 62,543 | ||||
| Milton Keynes South | BKM | SE | Con | Con | 32,011 | 50.0% | 6,944 | 66.4% | 32,011 | 25,067 | 4,688 | 1,495 | 746 | 64,007 | |||
| Mitcham and Morden | LND | LND | Lab | Lab | 27,964 | 61.1% | 16,482 | 65.3% | 11,482 | 27,964 | 3,717 | 1,160 | 1,202 | 216 | 45,741 | ||
| Mole Valley | SRY | SE | Con | Con | 31,656 | 55.4% | 12,041 | 76.5% | 31,656 | 2,965 | 19,615 | 1,874 | 1000 | 57,110 | |||
| Morecambe and Lunesdale | LAN | NW | Con | Con | 23,925 | 52.8% | 6,354 | 67.2% | 23,925 | 17,571 | 2,328 | 938 | 548 | 45,310 | |||
| Morley and Outwood | WYK | YTH | Con | Con | 29,424 | 56.7% | 11,267 | 65.9% | 29,424 | 18,157 | 2,285 | 1,107 | 957 | 51,930 | |||
| New Forest East | HAM | SE | Con | Con | 32,769 | 64.5% | 25,251 | 69.1% | 32,769 | 7,518 | 7,390 | 2,434 | 675 | 50,786 | |||
| New Forest West | HAM | SE | Con | Con | 32,113 | 63.8% | 24,403 | 71.0% | 32,113 | 6,595 | 7,710 | 3,888 | 50,306 | ||||
| Newark | NTT | EM | Con | Con | 34,660 | 63.3% | 21,816 | 72.2% | 34,660 | 12,844 | 5,308 | 1,950 | 54,762 | ||||
| Newbury | BRK | SE | Con | Con | 34,431 | 57.4% | 16,047 | 71.9% | 34,431 | 4,404 | 18,384 | 2,454 | 325 | 59,998 | |||
| Newcastle upon Tyne Central | TWR | NE | Lab | Lab | 21,568 | 57.6% | 12,278 | 64.8% | 9,290 | 21,568 | 2,709 | 1,365 | 2,542 | 37,474 | |||
| Newcastle upon Tyne East | TWR | NE | Lab | Lab | 26,049 | 60.1% | 15,463 | 68.0% | 10,586 | 26,049 | 4,535 | 2,195 | 43,365 | ||||
| Newcastle upon Tyne North | TWR | NE | Lab | Lab | 21,354 | 45.4% | 5,765 | 68.6% | 15,589 | 21,534 | 4,357 | 1,368 | 4,331 | 46,999 | |||
| Newcastle-under-Lyme | STS | WM | Lab | Con | 23,485 | 52.5% | 7,446 | 65.6% | 23,485 | 16,039 | 2,361 | 933 | 1,921 | 44,739 | |||
| Newton Abbot | DEV | SW | Con | Con | 29,190 | 55.5% | 17,501 | 72.5% | 29,190 | 9,329 | 11,689 | 1,508 | 840 | 52,556 | |||
| Normanton, Pontefract and Castleford | WYK | YTH | Lab | Lab | 18,297 | 37.9% | 1,276 | 57.1% | 17,021 | 18,297 | 3,147 | 8,032 | 1,762 | 48,259 | |||
| North Cornwall | CUL | SW | Con | Con | 30,671 | 59.4% | 14,752 | 73.9% | 30,671 | 4,516 | 15,919 | 572 | 51,678 | ||||
| North Devon | DEV | SW | Con | Con | 31,479 | 56.6% | 14,813 | 73.3% | 31,479 | 5,097 | 16,666 | 1,759 | 580 | 55,581 | |||
| North Dorset | DOR | SW | Con | Con | 35,705 | 63.6% | 24,301 | 73.1% | 35,705 | 6,737 | 11,404 | 2,261 | 56,107 | ||||
| North Durham | DUR | NE | Lab | Lab | 18,639 | 44.2% | 4,742 | 63.2% | 13,897 | 18,639 | 2,879 | 1,126 | 4,693 | 961 | 42,195 | ||
| North East Bedfordshire | BDF | E | Con | Con | 38,443 | 59.1% | 24,283 | 71.7% | 38,443 | 14,160 | 7,999 | 1,891 | 2,525 | 65,018 | |||
| North East Cambridgeshire | CAM | E | Con | Con | 38,423 | 72.5% | 29,993 | 63.3% | 38,423 | 8,430 | 4,298 | 1,813 | 52,964 | ||||
| North East Derbyshire | DBY | EM | Con | Con | 28,897 | 58.7% | 12,876 | 68.0% | 28,897 | 16,021 | 3,021 | 1,278 | 49,217 | ||||
| North East Hampshire | HAM | SE | Con | Con | 35,280 | 59.5% | 20,211 | 75.1% | 35,280 | 5,760 | 15,069 | 1,754 | 1,407 | 59,270 | |||
| North East Hertfordshire | HRT | E | Con | Con | 31,293 | 56.6% | 18,189 | 72.7% | 31,293 | 13,104 | 8,563 | 2,367 | 55,327 | ||||
| North East Somerset | AVN | SW | Con | Con | 28,360 | 50.4% | 14,729 | 76.4% | 28,360 | 13,631 | 12,422 | 1,423 | 472 | 56,308 | |||
| North Herefordshire | HWR | WM | Con | Con | 32,158 | 63.0% | 24,856 | 72.6% | 32,158 | 6,804 | 7,302 | 4,769 | 51,033 | ||||
| North Norfolk | NFK | E | LD | Con | 29,792 | 58.6% | 14,395 | 71.9% | 29,792 | 3,895 | 15,397 | 1,739 | 50,823 | ||||
| North Shropshire | SAL | WM | Con | Con | 35,444 | 62.7% | 22,949 | 67.9% | 35,444 | 12,495 | 5,643 | 1,790 | 1,141 | 56,513 | |||
| North Somerset | AVN | SW | Con | Con | 32,801 | 52.9% | 17,536 | 77.4% | 32,801 | 15,265 | 11,051 | 2,938 | 62,055 | ||||
| North Swindon | WIL | SW | Con | Con | 32,584 | 59.1% | 16,171 | 66.9% | 32,584 | 16,413 | 4,408 | 1,710 | 55,115 | ||||
| North Thanet | KEN | SE | Con | Con | 30,066 | 62.4% | 17,189 | 66.2% | 30,066 | 12,877 | 3,439 | 1,796 | 48,178 | ||||
| North Tyneside | TWR | NE | Lab | Lab | 25,051 | 49.7% | 9,561 | 63.9% | 15,490 | 25,051 | 3,241 | 1,393 | 5,254 | 50,429 | |||
| North Warwickshire | WAR | WM | Con | Con | 30,249 | 65.9% | 17,956 | 65.3% | 30,249 | 12,293 | 2,069 | 1,303 | 45,914 | ||||
| North West Cambridgeshire | CAM | E | Con | Con | 40,307 | 62.5% | 25,983 | 68.0% | 40,307 | 14,324 | 6,881 | 3,021 | 64,533 | ||||
| North West Durham | DUR | NE | Lab | Con | 19,990 | 41.9% | 1,144 | 66.0% | 19,990 | 18,846 | 2,831 | 1,173 | 3,193 | 1,630 | 47,663 | ||
| North West Hampshire | HAM | SE | Con | Con | 36,591 | 62.1% | 26,308 | 70.9% | 36,591 | 9,327 | 10,283 | 2,717 | 58,918 | ||||
| North West Leicestershire | LEI | EM | Con | Con | 33,811 | 62.8% | 20,400 | 68.2% | 33,811 | 13,411 | 3,614 | 2,478 | 507 | 53,821 | |||
| North West Norfolk | NFK | E | Con | Con | 30,627 | 65.7% | 19,922 | 64.7% | 30,627 | 10,705 | 3,625 | 1,645 | 46,602 | ||||
| North Wiltshire | WIL | SW | Con | Con | 32,373 | 59.1% | 17,626 | 74.7% | 32,373 | 5,699 | 14,747 | 1,939 | 54,758 | ||||
| Northampton North | NTH | EM | Con | Con | 21,031 | 53.2% | 5,507 | 67.3% | 21,031 | 15,524 | 2,031 | 953 | 39,539 | ||||
| Northampton South | NTH | EM | Con | Con | 20,914 | 51.2% | 4,697 | 65.7% | 20,914 | 16,217 | 2,482 | 1,222 | 40,835 | ||||
| Norwich North | NFK | E | Con | Con | 23,397 | 50.5% | 4,738 | 68.9% | 23,397 | 18,659 | 2,663 | 1,078 | 488 | 46,285 | |||
| Norwich South | NFK | E | Lab | Lab | 27,766 | 53.7% | 12,760 | 66.4% | 15,006 | 27,766 | 4,776 | 2,469 | 1,656 | 51,673 | |||
| Nottingham East | NTT | EM | Lab | Lab | 25,735 | 64.3% | 17,393 | 60.4% | 8,342 | 25,735 | 1,954 | 1,183 | 1,343 | 1,447 | 40,004 | ||
| Nottingham North | NTT | EM | Lab | Lab | 17,337 | 49.1% | 4,490 | 53.1% | 12,847 | 17,337 | 1,582 | 868 | 2,686 | 35,320 | |||
| Nottingham South | NTT | EM | Lab | Lab | 26,586 | 55.2% | 12,568 | 60.6% | 14,018 | 26,586 | 3,935 | 1,583 | 2,012 | 48,134 | |||
| Nuneaton | WAR | WM | Con | Con | 27,390 | 60.6% | 13,144 | 64.3% | 27,390 | 14,246 | 1,862 | 1,692 | 45,190 | ||||
| Old Bexley and Sidcup | LND | LND | Con | Con | 29,786 | 64.5% | 18,952 | 69.8% | 29,786 | 10,834 | 3,822 | 1,477 | 226 | 46,145 | |||
| Oldham East and Saddleworth | GTM | NW | Lab | Lab | 20,088 | 43.5% | 1,499 | 64.0% | 18,589 | 20,088 | 2,423 | 778 | 2,980 | 1,306 | 46,164 | ||
| Oldham West and Royton | GTM | NW | Lab | Lab | 24,579 | 55.3% | 11,127 | 60.9% | 13,452 | 24,579 | 1,484 | 681 | 3,316 | 922 | 44,434 | ||
| Orpington | LND | LND | Con | Con | 30,882 | 63.4% | 22,378 | 70.7% | 30,882 | 8,504 | 7,552 | 1,783 | 48,721 | ||||
| Oxford East | OXF | SE | Lab | Lab | 28,135 | 57.0% | 17,832 | 63.0% | 10,303 | 28,135 | 6,884 | 2,392 | 1,146 | 499 | 49,359 | ||
| Oxford West and Abingdon | OXF | SE | LD | LD | 31,340 | 53.3% | 8,943 | 76.4% | 22,397 | 4,258 | 31,340 | 829 | 58,824 | ||||
| Pendle | LAN | NW | Con | Con | 24,076 | 54.2% | 6,186 | 68.1% | 24,076 | 17,890 | 1,548 | 678 | 268 | 44,460 | |||
| Penistone and Stocksbridge | SYK | YTH | Lab | Con | 23,688 | 47.8% | 7,210 | 69.8% | 23,688 | 16,478 | 5,054 | 4,300 | 49,520 | ||||
| Penrith and The Border | CMA | NW | Con | Con | 28,875 | 60.4% | 18,519 | 70.8% | 28,875 | 10,356 | 5,364 | 2,159 | 1,070 | 47,824 | |||
| Peterborough | CAM | E | Lab | Con | 22,334 | 46.7% | 2,580 | 65.9% | 22,334 | 19,754 | 2,334 | 728 | 2,127 | 524 | 47,801 | ||
| Plymouth Moor View | DEV | SW | Con | Con | 26,831 | 60.7% | 12,897 | 63.7% | 26,831 | 13,934 | 2,301 | 1,173 | 44,239 | ||||
| Plymouth Sutton and Devonport | DEV | SW | Lab | Lab | 25,461 | 47.9% | 4,757 | 68.3% | 20,704 | 25,461 | 2,545 | 1,557 | 2,909 | 53,176 | |||
| Poole | DOR | SW | Con | Con | 29,599 | 58.7% | 19,116 | 68.2% | 29,599 | 10,483 | 7,819 | 1,702 | 848 | 50,451 | |||
| Poplar and Limehouse | LND | LND | Lab | Lab | 38,660 | 63.1% | 28,904 | 66.7% | 9,756 | 38,660 | 8,832 | 2,159 | 1,493 | 376 | 61,276 | ||
| Portsmouth North | HAM | SE | Con | Con | 28,172 | 61.4% | 15,780 | 64.4% | 28,172 | 12,392 | 3,419 | 1,304 | 623 | 45,910 | |||
| Portsmouth South | HAM | SE | Lab | Lab | 23,068 | 48.6% | 5,363 | 63.9% | 17,705 | 23,068 | 5,418 | 994 | 240 | 47,425 | |||
| Preston | LAN | NW | Lab | Lab | 20,870 | 61.8% | 12,146 | 56.6% | 8,724 | 20,870 | 1,737 | 660 | 1,799 | 33,790 | |||
| Pudsey | WYK | YTH | Con | Con | 26,453 | 48.8% | 3,517 | 74.1% | 26,453 | 22,936 | 3,088 | 894 | 844 | 54,215 | |||
| Putney | LND | LND | Con | Lab | 22,780 | 45.1% | 4,774 | 77.0% | 18,006 | 22,780 | 8,548 | 1,133 | 50,467 | ||||
| Rayleigh and Wickford | ESS | E | Con | Con | 39,864 | 72.6% | 31,000 | 69.5% | 39,864 | 8,864 | 4,171 | 2,002 | 54,901 | ||||
| Reading East | BRK | SE | Lab | Lab | 27,102 | 48.5% | 5,924 | 72.2% | 21,178 | 27,102 | 5,035 | 1,549 | 852 | 202 | 55,918 | ||
| Reading West | BRK | SE | Con | Con | 24,393 | 48.4% | 4,117 | 67.9% | 24,393 | 20,276 | 4,460 | 1,263 | 50,392 | ||||
| Redcar | CLV | NE | Lab | Con | 18,811 | 46.1% | 3,527 | 62.0% | 18,811 | 15,284 | 2,018 | 491 | 2,915 | 1,323 | 40,842 | ||
| Redditch | HWR | WM | Con | Con | 27,907 | 63.3% | 16,036 | 67.4% | 27,907 | 11,871 | 2,905 | 1,384 | 44,067 | ||||
| Reigate | SRY | SE | Con | Con | 28,665 | 53.9% | 18,310 | 71.0% | 28,665 | 10,355 | 10,320 | 3,169 | 647 | 53,156 | |||
| Ribble Valley | LAN | NW | Con | Con | 33,346 | 60.3% | 18,439 | 69.8% | 33,346 | 14,907 | 4,776 | 1,704 | 551 | 55,284 | |||
| Richmond (Yorks) | NYK | YTH | Con | Con | 36,693 | 63.6% | 27,210 | 69.9% | 36,693 | 9,483 | 6,989 | 2,500 | 2,038 | 57,703 | |||
| Richmond Park | LND | LND | Con | LD | 34,559 | 53.1% | 7,766 | 78.7% | 26,793 | 3,407 | 34,559 | 308 | 65,067 | ||||
| Rochdale | GTM | NW | Lab | Lab | 24,475 | 51.6% | 9,668 | 60.1% | 14,807 | 24,475 | 3,312 | 986 | 3,867 | 47,447 | |||
| Rochester and Strood | KEN | SE | Con | Con | 31,151 | 60.0% | 17,072 | 63.3% | 31,151 | 14,079 | 3,717 | 1,312 | 1,667 | 51,926 | |||
| Rochford and Southend East | ESS | E | Con | Con | 27,063 | 58.7% | 12,286 | 61.2% | 27,063 | 14,777 | 2,822 | 1,474 | 46,136 | ||||
| Romford | LND | LND | Con | Con | 30,494 | 64.6% | 17,893 | 65.3% | 30,494 | 12,601 | 2,708 | 1,428 | 47,231 | ||||
| Romsey and Southampton North | HAM | SE | Con | Con | 27,862 | 54.2% | 10,872 | 75.3% | 27,862 | 5,898 | 16,990 | 640 | 51,390 | ||||
| Rossendale and Darwen | LAN | NW | Con | Con | 27,570 | 56.5% | 9,522 | 67.1% | 27,570 | 18,048 | 2,011 | 1,193 | 48,822 | ||||
| Rother Valley | SYK | YTH | Lab | Con | 21,970 | 45.1% | 6,318 | 65.1% | 21,970 | 15,652 | 2,553 | 1,219 | 6,264 | 1,040 | 48,698 | ||
| Rotherham | SYK | YTH | Lab | Lab | 14,736 | 41.3% | 3,121 | 57.8% | 11,615 | 14,736 | 2,090 | 6,125 | 1,085 | 35,651 | |||
| Rugby | WAR | WM | Con | Con | 29,255 | 57.6% | 13,447 | 70.2% | 29,255 | 15,808 | 4,207 | 1,544 | 50,814 | ||||
| Ruislip, Northwood and Pinner | LND | LND | Con | Con | 29,391 | 55.6% | 16,394 | 72.1% | 29,391 | 12,997 | 7,986 | 1,646 | 884 | 52,904 | |||
| Runnymede and Weybridge | SRY | SE | Con | Con | 29,262 | 54.9% | 18,270 | 69.0% | 29,262 | 10,992 | 9,236 | 1,876 | 1,923 | 53,289 | |||
| Rushcliffe | NTT | EM | Con | Con | 28,765 | 47.5% | 7,643 | 78.5% | 28,765 | 21,122 | 9,600 | 1,018 | 60,505 | ||||
| Rutland and Melton | LEI | EM | Con | Con | 36,507 | 62.6% | 26,924 | 70.5% | 36,507 | 9,583 | 7,970 | 2,875 | 1,375 | 58,310 | |||
| Saffron Walden | ESS | E | Con | Con | 39,714 | 63.0% | 27,594 | 72.5% | 39,714 | 8,305 | 12,120 | 2,947 | 63,086 | ||||
| Salford and Eccles | GTM | NW | Lab | Lab | 28,755 | 56.8% | 16,327 | 61.6% | 12,428 | 28,755 | 3,099 | 2,060 | 4,290 | 50,632 | |||
| Salisbury | WIL | SW | Con | Con | 30,280 | 56.4% | 19,736 | 72.1% | 30,280 | 9,675 | 10,544 | 2,486 | 745 | 53,730 | |||
| Scarborough and Whitby | NYK | YTH | Con | Con | 27,593 | 55.5% | 10,270 | 66.8% | 27,593 | 17,323 | 3,038 | 1,770 | 49,724 | ||||
| Scunthorpe | HUM | YTH | Lab | Con | 20,306 | 53.8% | 6,451 | 60.9% | 20,306 | 13,855 | 875 | 670 | 2,044 | 37,750 | |||
| Sedgefield | DUR | NE | Lab | Con | 19,609 | 47.2% | 4,513 | 64.6% | 19,609 | 15,096 | 1,955 | 994 | 3,518 | 394 | 41,566 | ||
| Sefton Central | MSY | NW | Lab | Lab | 29,254 | 57.5% | 15,122 | 72.9% | 14,132 | 29,254 | 3,386 | 1,261 | 2,425 | 422 | 50,880 | ||
| Selby and Ainsty | NYK | YTH | Con | Con | 33,995 | 60.3% | 20,137 | 71.7% | 33,995 | 13,858 | 4,842 | 1,823 | 1,900 | 56,418 | |||
| Sevenoaks | KEN | SE | Con | Con | 30,932 | 60.7% | 20,818 | 71.0% | 30,932 | 6,946 | 10,114 | 1,974 | 990 | 50,956 | |||
| Sheffield Brightside and Hillsborough | SYK | YTH | Lab | Lab | 22,369 | 56.5% | 12,274 | 57.1% | 10,095 | 22,369 | 1,517 | 1,179 | 3,855 | 585 | 39,600 | ||
| Sheffield Central | SYK | YTH | Lab | Lab | 33,968 | 66.7% | 27,273 | 56.7% | 6,695 | 33,968 | 3,237 | 4,570 | 1,969 | 474 | 50,913 | ||
| Sheffield Hallam | SYK | YTH | Lab | Lab | 19,709 | 34.6% | 712 | 78.2% | 14,696 | 19,709 | 18,997 | 1,630 | 1,562 | 291 | 56,885 | ||
| Sheffield Heeley | SYK | YTH | Lab | Lab | 21,475 | 50.3% | 8,520 | 63.8% | 12,955 | 21,475 | 2,916 | 1,811 | 3,538 | 42,695 | |||
| Sheffield South East | SYK | YTH | Lab | Lab | 19,359 | 46.1% | 4,289 | 61.9% | 15,070 | 19,359 | 2,125 | 4,478 | 966 | 41,998 | |||
| Sherwood | NTT | EM | Con | Con | 32,049 | 60.8% | 16,186 | 67.6% | 32,049 | 15,863 | 2,883 | 1,214 | 700 | 52,709 | |||
| Shipley | WYK | YTH | Con | Con | 27,437 | 50.8% | 6,242 | 72.9% | 27,437 | 21,195 | 3,188 | 1,301 | 803 | 53,924 | |||
| Shrewsbury and Atcham | SAL | WM | Con | Con | 31,021 | 52.5% | 11,217 | 71.8% | 31,021 | 19,804 | 5,906 | 1,762 | 572 | 59,065 | |||
| Sittingbourne and Sheppey | KEN | SE | Con | Con | 34,742 | 67.6% | 24,479 | 61.2% | 34,742 | 10,263 | 3,213 | 1,188 | 1,988 | 51,394 | |||
| Skipton and Ripon | NYK | YTH | Con | Con | 34,919 | 59.5% | 19,985 | 74.4% | 34,919 | 11,225 | 8,701 | 2,748 | 1,131 | 58,724 | |||
| Sleaford and North Hykeham | LIN | EM | Con | Con | 44,683 | 67.1% | 32,565 | 70.2% | 44,683 | 12,118 | 5,355 | 1,742 | 2,656 | 66,554 | |||
| Slough | BRK | SE | Lab | Lab | 29,421 | 57.6% | 13,640 | 58.1% | 15,781 | 29,421 | 3,357 | 1,047 | 1,432 | 51,038 | |||
| Solihull | WMD | WM | Con | Con | 32,309 | 58.4% | 21,273 | 70.3% | 32,309 | 11,036 | 9,977 | 2,022 | 55,344 | ||||
| Somerton and Frome | SOM | SW | Con | Con | 36,230 | 55.8% | 19,213 | 75.6% | 36,230 | 8,354 | 17,017 | 3,295 | 64,896 | ||||
| South Basildon and East Thurrock | ESS | E | Con | Con | 29,973 | 66.2% | 19,922 | 60.8% | 29,973 | 10,051 | 1,957 | 3,316 | 45,297 | ||||
| South Cambridgeshire | CAM | E | Con | Con | 31,015 | 46.3% | 2,904 | 76.7% | 31,015 | 7,803 | 28,111 | 66,929 | |||||
| South Derbyshire | DBY | EM | Con | Con | 33,502 | 62.8% | 19,335 | 67.3% | 33,502 | 14,167 | 3,924 | 1,788 | 53,381 | ||||
| South Dorset | DOR | SW | Con | Con | 30,024 | 58.8% | 17,153 | 69.4% | 30,024 | 12,871 | 5,432 | 2,246 | 485 | 51,058 | |||
| South East Cambridgeshire | CAM | E | Con | Con | 32,187 | 50.0% | 11,490 | 74.2% | 32,187 | 10,492 | 20,697 | 1,009 | 64,385 | ||||
| South East Cornwall | CUL | SW | Con | Con | 31,807 | 59.3% | 20,971 | 74.7% | 31,807 | 10,836 | 8,650 | 1,493 | 869 | 53,655 | |||
| South Holland and The Deepings | LIN | EM | Con | Con | 37,338 | 75.9% | 30,838 | 64.7% | 37,338 | 6,500 | 3,225 | 1,613 | 503 | 49,179 | |||
| South Leicestershire | LEI | EM | Con | Con | 36,791 | 64.0% | 24,004 | 71.4% | 36,791 | 12,787 | 5,452 | 2,439 | 57,469 | ||||
| South Norfolk | NFK | E | Con | Con | 36,258 | 58.0% | 21,275 | 72.5% | 36,258 | 14,983 | 8,744 | 2,499 | 62,484 | ||||
| South Northamptonshire | NTH | EM | Con | Con | 41,755 | 62.4% | 27,761 | 73.7% | 41,755 | 13,994 | 7,891 | 2,634 | 634 | 66,908 | |||
| South Ribble | LAN | NW | Con | Con | 30,028 | 55.8% | 11,199 | 71.4% | 30,028 | 18,829 | 3,720 | 1,207 | 53,784 | ||||
| South Shields | TWR | NE | Lab | Lab | 17,273 | 45.6% | 9,585 | 60.3% | 7,688 | 17,273 | 1,514 | 1,303 | 6,446 | 3,658 | 37,882 | ||
| South Staffordshire | STS | WM | Con | Con | 36,520 | 73.0% | 28,250 | 67.9% | 36,520 | 8,270 | 3,280 | 1,935 | 50,005 | ||||
| South Suffolk | SFK | E | Con | Con | 33,270 | 62.2% | 22,897 | 70.2% | 33,270 | 10,373 | 6,702 | 3,144 | 53,489 | ||||
| South Swindon | WIL | SW | Con | Con | 26,536 | 52.3% | 6,625 | 70.0% | 26,536 | 19,911 | 4,299 | 50,746 | |||||
| South Thanet | KEN | SE | Con | Con | 27,084 | 56.1% | 10,587 | 65.8% | 27,084 | 16,497 | 2,727 | 1,949 | 48,257 | ||||
| South West Bedfordshire | BDF | E | Con | Con | 32,212 | 60.4% | 18,583 | 66.7% | 32,212 | 13,629 | 5,435 | 2,031 | 53,307 | ||||
| South West Devon | DEV | SW | Con | Con | 33,286 | 62.4% | 21,430 | 73.6% | 33,286 | 11,856 | 6,207 | 2,018 | 53,367 | ||||
| South West Hertfordshire | HRT | E | Con | Con | 30,327 | 49.6% | 14,408 | 76.1% | 30,327 | 7,228 | 6,251 | 1,466 | 15,919 | 61,191 | |||
| South West Norfolk | NFK | E | Con | Con | 35,507 | 69.0% | 26,195 | 65.6% | 35,507 | 9,312 | 4,166 | 1,645 | 836 | 51,466 | |||
| South West Surrey | SRY | SE | Con | Con | 32,191 | 53.3% | 8,817 | 76.3% | 32,191 | 4,775 | 23,374 | 60,340 | |||||
| South West Wiltshire | WIL | SW | Con | Con | 33,038 | 60.2% | 21,630 | 70.4% | 33,038 | 11,408 | 8,015 | 2,434 | 54,895 | ||||
| Southampton Itchen | HAM | SE | Con | Con | 23,952 | 50.5% | 4,498 | 65.6% | 23,952 | 19,454 | 2,503 | 1,040 | 472 | 47,421 | |||
| Southampton Test | HAM | SE | Lab | Lab | 22,256 | 49.5% | 6,213 | 64.2% | 16,043 | 22,256 | 3,449 | 1,433 | 1,591 | 222 | 44,994 | ||
| Southend West | ESS | E | Con | Con | 27,555 | 59.2% | 14,459 | 67.8% | 27,555 | 13,096 | 5,312 | 574 | 46,537 | ||||
| Southport | MSY | NW | Con | Con | 22,914 | 47.6% | 4,147 | 71.6% | 22,914 | 18,767 | 6,499 | 48,180 | |||||
| Spelthorne | SRY | SE | Con | Con | 29,141 | 58.9% | 18,393 | 69.8% | 29,141 | 10,748 | 7,499 | 2,122 | 49,510 | ||||
| St Albans | HRT | E | Con | LD | 28,867 | 50.1% | 6,293 | 78.1% | 22,574 | 5,000 | 28,867 | 1,004 | 154 | 57,599 | |||
| St Austell and Newquay | CUL | SW | Con | Con | 31,273 | 56.1% | 16,526 | 69.8% | 31,273 | 14,747 | 5,861 | 1,609 | 2,286 | 55,776 | |||
| St Helens North | MSY | NW | Lab | Lab | 24,870 | 52.3% | 12,209 | 62.9% | 12,661 | 24,870 | 2,668 | 1,966 | 5,396 | 47,561 | |||
| St Helens South and Whiston | MSY | NW | Lab | Lab | 29,457 | 59.0% | 19,122 | 63.6% | 10,335 | 29,457 | 2,886 | 2,282 | 5,353 | 50,313 | |||
| St Ives | CUL | SW | Con | Con | 25,365 | 49.3% | 4,284 | 74.7% | 25,365 | 3,553 | 21,081 | 954 | 446 | 51,399 | |||
| Stafford | STS | WM | Con | Con | 29,992 | 58.6% | 14,377 | 70.5% | 29,992 | 15,615 | 3,175 | 2,367 | 51,149 | ||||
| Staffordshire Moorlands | STS | WM | Con | Con | 28,192 | 64.6% | 16,428 | 66.7% | 28,192 | 11,764 | 2,469 | 1,231 | 43,656 | ||||
| Stalybridge and Hyde | GTM | NW | Lab | Lab | 19,025 | 44.7% | 2,946 | 58.2% | 16,079 | 19,025 | 1,827 | 1,411 | 3,591 | 435 | 42,368 | ||
| Stevenage | HRT | E | Con | Con | 25,328 | 53.1% | 8,562 | 66.6% | 25,328 | 16,766 | 4,132 | 1,457 | 47,683 | ||||
| Stockport | GTM | NW | Lab | Lab | 21,695 | 52.0% | 10,039 | 64.1% | 11,656 | 21,695 | 5,043 | 1,403 | 1,918 | 41,715 | |||
| Stockton North | CLV | NE | Lab | Lab | 17,728 | 43.1% | 1,027 | 61.7% | 16,701 | 17,728 | 1,631 | 3,907 | 1,189 | 41,156 | |||
| Stockton South | CLV | NE | Lab | Con | 27,764 | 50.7% | 5,260 | 71.3% | 27,764 | 22,504 | 2,338 | 2,196 | 54,802 | ||||
| Stoke-on-Trent Central | STS | WM | Lab | Con | 14,557 | 45.4% | 670 | 57.9% | 14,557 | 13,887 | 1,116 | 819 | 1,691 | 32,070 | |||
| Stoke-on-Trent North | STS | WM | Lab | Con | 20,974 | 52.3% | 6,286 | 57.5% | 20,974 | 14,688 | 1,268 | 508 | 2,374 | 322 | 40,134 | ||
| Stoke-on-Trent South | STS | WM | Con | Con | 24,632 | 62.2% | 11,271 | 61.4% | 24,632 | 13,361 | 1,611 | 39,604 | |||||
| Stone | STS | WM | Con | Con | 31,687 | 63.6% | 19,945 | 71.8% | 31,687 | 11,742 | 4,412 | 2,002 | 49,843 | ||||
| Stourbridge | WMD | WM | Con | Con | 27,534 | 60.3% | 13,571 | 65.4% | 27,534 | 13,963 | 2,523 | 1,048 | 621 | 45,689 | |||
| Stratford-on-Avon | WAR | WM | Con | Con | 33,343 | 60.6% | 19,972 | 74.4% | 33,343 | 6,222 | 13,371 | 2,112 | 55,048 | ||||
| Streatham | LND | LND | Lab | Lab | 30,976 | 54.8% | 17,690 | 68.9% | 9,060 | 30,976 | 13,286 | 2,567 | 624 | 56,513 | |||
| Stretford and Urmston | GTM | NW | Lab | Lab | 30,195 | 60.3% | 16,417 | 69.4% | 13,778 | 30,195 | 2,969 | 1,357 | 1,768 | 50,067 | |||
| Stroud | GLS | SW | Lab | Con | 31,582 | 47.9% | 3,840 | 78.2% | 31,582 | 27,742 | 4,954 | 1,085 | 567 | 65,930 | |||
| Suffolk Coastal | SFK | E | Con | Con | 32,958 | 56.5% | 20,533 | 71.2% | 32,958 | 12,425 | 8,719 | 2,713 | 1,493 | 58,308 | |||
| Sunderland Central | TWR | NE | Lab | Lab | 18,336 | 42.2% | 2,964 | 59.8% | 15,372 | 18,336 | 3,025 | 1,212 | 5,047 | 484 | 43,476 | ||
| Surrey Heath | SRY | SE | Con | Con | 34,358 | 58.6% | 18,349 | 72.1% | 34,358 | 5,407 | 16,009 | 2,252 | 628 | 58,654 | |||
| Sutton and Cheam | LND | LND | Con | Con | 25,235 | 50.0% | 8,351 | 70.4% | 25,235 | 7,200 | 16,884 | 1,168 | 50,487 | ||||
| Sutton Coldfield | WMD | WM | Con | Con | 31,604 | 60.4% | 19,272 | 69.2% | 31,604 | 12,332 | 6,358 | 2,031 | 52,325 | ||||
| Tamworth | STS | WM | Con | Con | 30,542 | 66.3% | 19,634 | 64.3% | 30,542 | 10,908 | 2,426 | 935 | 1,245 | 46,056 | |||
| Tatton | CHS | NW | Con | Con | 28,277 | 57.7% | 17,387 | 70.9% | 28,277 | 10,890 | 7,712 | 2,088 | 48,967 | ||||
| Taunton Deane | SOM | SW | Con | Con | 34,164 | 53.6% | 11,700 | 71.9% | 34,164 | 4,715 | 22,464 | 2,390 | 63,733 | ||||
| Telford | SAL | WM | Con | Con | 25,546 | 59.7% | 10,941 | 62.1% | 25,546 | 14,605 | 2,674 | 42,825 | |||||
| Tewkesbury | GLS | SW | Con | Con | 35,728 | 58.4% | 22,410 | 72.8% | 35,728 | 9,310 | 13,318 | 2,784 | 61,140 | ||||
| The Cotswolds | GLS | SW | Con | Con | 35,484 | 58.0% | 20,214 | 74.7% | 35,484 | 7,110 | 15,270 | 3,312 | 61,176 | ||||
| The Wrekin | SAL | WM | Con | Con | 31,029 | 63.5% | 18,726 | 69.2% | 31,029 | 12,303 | 4,067 | 1,491 | 48,890 | ||||
| Thirsk and Malton | NYK | YTH | Con | Con | 35,634 | 63.0% | 25,154 | 69.9% | 35,634 | 10,480 | 6,774 | 2,263 | 1,437 | 56,588 | |||
| Thornbury and Yate | AVN | SW | Con | Con | 30,202 | 57.8% | 12,369 | 75.2% | 30,202 | 4,208 | 17,833 | 52,243 | |||||
| Thurrock | ESS | E | Con | Con | 27,795 | 58.6% | 11,482 | 59.6% | 27,795 | 16,313 | 1,510 | 807 | 1,042 | 47,467 | |||
| Tiverton and Honiton | DEV | SW | Con | Con | 35,893 | 60.2% | 24,239 | 71.9% | 35,893 | 11,654 | 8,807 | 2,291 | 968 | 59,613 | |||
| Tonbridge and Malling | KEN | SE | Con | Con | 35,784 | 62.8% | 26,941 | 73.7% | 35,784 | 8,286 | 8,843 | 4,090 | 57,003 | ||||
| Tooting | LND | LND | Lab | Lab | 30,811 | 52.7% | 14,307 | 76.0% | 16,504 | 30,811 | 8,305 | 2,314 | 462 | 77 | 58,473 | ||
| Torbay | DEV | SW | Con | Con | 29,863 | 59.2% | 17,749 | 67.2% | 29,863 | 6,562 | 12,114 | 1,235 | 648 | 50,422 | |||
| Torridge and West Devon | DEV | SW | Con | Con | 35,904 | 60.1% | 24,992 | 74.6% | 35,904 | 10,290 | 10,912 | 2,077 | 547 | 59,730 | |||
| Totnes | DEV | SW | Con | Con | 27,751 | 53.2% | 12,724 | 74.7% | 27,751 | 8,860 | 15,027 | 544 | 52,182 | ||||
| Tottenham | LND | LND | Lab | Lab | 35,621 | 76.0% | 30,175 | 61.9% | 5,446 | 35,621 | 3,168 | 1,873 | 527 | 221 | 46,856 | ||
| Truro and Falmouth | CUL | SW | Con | Con | 27,237 | 46.0% | 4,561 | 77.2% | 27,237 | 22,676 | 7,150 | 1,714 | 413 | 59,190 | |||
| Tunbridge Wells | KEN | SE | Con | Con | 30,119 | 55.1% | 14,645 | 73.0% | 30,119 | 8,098 | 15,474 | 959 | 54,650 | ||||
| Twickenham | LND | LND | LD | LD | 36,166 | 56.1% | 14,121 | 76.0% | 22,045 | 5,476 | 36,166 | 816 | 64,503 | ||||
| Tynemouth | TWR | NE | Lab | Lab | 26,928 | 48.1% | 4,857 | 72.5% | 22,071 | 26,928 | 3,791 | 1,281 | 1,963 | 56,034 | |||
| Uxbridge and South Ruislip | LND | LND | Con | Con | 25,351 | 52.6% | 7,210 | 68.5% | 25,351 | 18,141 | 3,026 | 1,090 | 296 | 47,904 | |||
| Vauxhall | LND | LND | Lab | Lab | 31,615 | 56.1% | 19,612 | 63.9% | 9,422 | 31,615 | 12,003 | 2,516 | 641 | 136 | 56,333 | ||
| Wakefield | WYK | YTH | Lab | Con | 21,283 | 47.3% | 3,358 | 64.1% | 21,283 | 17,925 | 1,772 | 2,725 | 1,322 | 45,027 | |||
| Wallasey | MSY | NW | Lab | Lab | 29,901 | 64.3% | 18,322 | 70.1% | 11,579 | 29,901 | 1,843 | 1,132 | 2,037 | 46,492 | |||
| Walsall North | WMD | WM | Con | Con | 23,334 | 63.8% | 11,965 | 54.4% | 23,334 | 11,369 | 1,236 | 617 | 36,556 | ||||
| Walsall South | WMD | WM | Lab | Lab | 20,872 | 49.1% | 3,456 | 62.4% | 17,416 | 20,872 | 1,602 | 634 | 1,660 | 288 | 42,472 | ||
| Walthamstow | LND | LND | Lab | Lab | 36,784 | 76.1% | 30,862 | 68.8% | 5,922 | 36,784 | 2,874 | 1,733 | 768 | 254 | 48,335 | ||
| Wansbeck | NBL | NE | Lab | Lab | 17,124 | 42.3% | 814 | 64.0% | 16,310 | 17,124 | 2,539 | 1,217 | 3,141 | 178 | 40,509 | ||
| Wantage | OXF | SE | Con | Con | 34,085 | 50.7% | 12,653 | 73.9% | 34,085 | 10,181 | 21,432 | 1,475 | 67,173 | ||||
| Warley | WMD | WM | Lab | Lab | 21,901 | 58.8% | 11,511 | 59.7% | 10,390 | 21,901 | 1,588 | 891 | 2,469 | 37,239 | |||
| Warrington North | CHS | NW | Lab | Lab | 20,611 | 44.2% | 1,509 | 64.6% | 19,102 | 20,611 | 3,071 | 1,257 | 2,626 | 46,667 | |||
| Warrington South | CHS | NW | Lab | Con | 28,187 | 45.5% | 2,010 | 72.0% | 28,187 | 26,177 | 5,732 | 1,635 | 168 | 61,899 | |||
| Warwick and Leamington | WAR | WM | Lab | Lab | 23,718 | 43.8% | 789 | 71.0% | 22,929 | 23,718 | 4,995 | 1,536 | 807 | 220 | 54,205 | ||
| Washington and Sunderland West | TWR | NE | Lab | Lab | 15,941 | 42.5% | 3,723 | 56.6% | 12,218 | 15,941 | 2,071 | 1,005 | 5,439 | 839 | 37,513 | ||
| Watford | HRT | E | Con | Con | 26,421 | 45.5% | 4,433 | 69.7% | 26,421 | 21,988 | 9,323 | 333 | 58,065 | ||||
| Waveney | SFK | E | Con | Con | 31,778 | 62.2% | 18,002 | 61.8% | 31,778 | 13,776 | 2,603 | 2,727 | 245 | 51,129 | |||
| Wealden | SXE | SE | Con | Con | 37,043 | 60.8% | 25,655 | 73.3% | 37,043 | 9,377 | 11,388 | 3,099 | 60,907 | ||||
| Weaver Vale | CHS | NW | Lab | Lab | 22,772 | 44.9% | 562 | 71.9% | 22,210 | 22,772 | 3,300 | 1,051 | 1,380 | 50,713 | |||
| Wellingborough | NTH | EM | Con | Con | 32,277 | 62.2% | 18,550 | 64.3% | 32,277 | 13,737 | 4,078 | 1,821 | 51,913 | ||||
| Wells | SOM | SW | Con | Con | 33,336 | 54.1% | 9,991 | 73.5% | 33,336 | 4,304 | 23,345 | 580 | 61,565 | ||||
| Welwyn Hatfield | HRT | E | Con | Con | 27,394 | 52.6% | 10,955 | 69.5% | 27,394 | 16,439 | 6,602 | 1,618 | 52,053 | ||||
| Wentworth and Dearne | SYK | YTH | Lab | Lab | 16,742 | 40.3% | 2,165 | 55.8% | 14,577 | 16,742 | 1,705 | 7,019 | 1,514 | 41,557 | |||
| West Bromwich East | WMD | WM | Lab | Con | 16,804 | 46.7% | 1,593 | 57.9% | 16,804 | 15,211 | 1,313 | 627 | 1,475 | 545 | 35,975 | ||
| West Bromwich West | WMD | WM | Lab | Con | 17,419 | 50.5% | 3,799 | 53.4% | 17,419 | 13,620 | 915 | 664 | 1,841 | 34,459 | |||
| West Dorset | DOR | SW | Con | Con | 33,589 | 55.1% | 14,106 | 74.7% | 33,589 | 5,729 | 19,483 | 2,124 | 60,925 | ||||
| West Ham | LND | LND | Lab | Lab | 42,181 | 70.1% | 32,388 | 61.5% | 9,793 | 42,181 | 4,161 | 1,780 | 1,679 | 606 | 60,200 | ||
| West Lancashire | LAN | NW | Lab | Lab | 27,458 | 52.1% | 8,336 | 71.8% | 19,122 | 27,458 | 2,560 | 1,248 | 2,275 | 52,663 | |||
| West Suffolk | SFK | E | Con | Con | 33,842 | 65.8% | 23,194 | 64.1% | 33,842 | 10,648 | 4,685 | 2,262 | 51,437 | ||||
| West Worcestershire | HWR | WM | Con | Con | 34,909 | 60.7% | 24,499 | 75.4% | 34,909 | 9,496 | 10,410 | 2,715 | 57,530 | ||||
| Westminster North | LND | LND | Lab | Lab | 23,240 | 54.2% | 10,759 | 65.5% | 12,481 | 23,240 | 5,593 | 1,064 | 418 | 115 | 42,911 | ||
| Westmorland and Lonsdale | CMA | NW | LD | LD | 25,795 | 48.9% | 1,934 | 77.8% | 23,861 | 2,293 | 25,795 | 763 | 52,712 | ||||
| Weston-super-Mare | AVN | SW | Con | Con | 31,983 | 57.5% | 17,121 | 67.4% | 31,983 | 14,862 | 6,935 | 1,834 | 55,614 | ||||
| Wigan | GTM | NW | Lab | Lab | 21,042 | 46.7% | 6,728 | 59.5% | 14,314 | 21,042 | 2,428 | 1,299 | 5,959 | 45,042 | |||
| Wimbledon | LND | LND | Con | Con | 20,373 | 38.4% | 628 | 77.7% | 20,373 | 12,543 | 19,745 | 366 | 53,027 | ||||
| Winchester | HAM | SE | Con | Con | 28,430 | 48.3% | 985 | 77.9% | 28,430 | 2,723 | 27,445 | 292 | 58,890 | ||||
| Windsor | BRK | SE | Con | Con | 31,501 | 58.6% | 23,354 | 71.6% | 31,501 | 8,147 | 11,422 | 1,798 | 884 | 53,752 | |||
| Wirral South | MSY | NW | Lab | Lab | 22,284 | 51.2% | 6,105 | 76.0% | 16,179 | 22,284 | 2,917 | 948 | 1,219 | 43,547 | |||
| Wirral West | MSY | NW | Lab | Lab | 20,695 | 48.2% | 3,003 | 77.3% | 17,692 | 20,695 | 2,706 | 965 | 860 | 42,918 | |||
| Witham | ESS | E | Con | Con | 32,876 | 66.6% | 24,082 | 70.1% | 32,876 | 8,794 | 4,584 | 3,090 | 49,344 | ||||
| Witney | OXF | SE | Con | Con | 33,856 | 55.2% | 15,177 | 73.1% | 33,856 | 8,770 | 18,679 | 61,305 | |||||
| Woking | SRY | SE | Con | Con | 26,396 | 48.9% | 9,767 | 71.5% | 26,396 | 8,827 | 16,629 | 1,485 | 600 | 53,937 | |||
| Wokingham | BRK | SE | Con | Con | 30,734 | 49.6% | 7,383 | 73.8% | 30,734 | 6,450 | 23,351 | 1,382 | 80 | 61,997 | |||
| Wolverhampton North East | WMD | WM | Lab | Con | 17,722 | 51.7% | 4,080 | 55.4% | 17,722 | 13,642 | 960 | 603 | 1,354 | 34,281 | |||
| Wolverhampton South East | WMD | WM | Lab | Lab | 15,522 | 46.4% | 1,235 | 53.1% | 14,287 | 15,522 | 1,019 | 521 | 2,094 | 33,443 | |||
| Wolverhampton South West | WMD | WM | Lab | Con | 19,864 | 48.3% | 1,661 | 67.5% | 19,864 | 18,203 | 2,041 | 1,028 | 41,136 | ||||
| Worcester | HWR | WM | Con | Con | 25,856 | 50.8% | 6,758 | 69.3% | 25,856 | 19,098 | 3,666 | 1,694 | 584 | 50,898 | |||
| Workington | CMA | NW | Lab | Con | 20,488 | 49.3% | 4,176 | 67.8% | 20,488 | 16,312 | 1,525 | 596 | 1,749 | 929 | 41,599 | ||
| Worsley and Eccles South | GTM | NW | Lab | Lab | 20,446 | 45.7% | 3,219 | 59.4% | 17,227 | 20,446 | 2,510 | 1,300 | 3,224 | 44,707 | |||
| Worthing West | WSX | SE | Con | Con | 30,475 | 55.8% | 14,823 | 69.5% | 30,475 | 15,652 | 6,024 | 2,008 | 489 | 54,648 | |||
| Wycombe | BKM | SE | Con | Con | 24,766 | 45.2% | 4,214 | 70.1% | 24,766 | 20,552 | 6,543 | 1,454 | 1,441 | 54,756 | |||
| Wyre and Preston North | LAN | NW | Con | Con | 31,589 | 59.7% | 16,781 | 70.4% | 31,589 | 14,808 | 4,463 | 1,729 | 335 | 52,924 | |||
| Wyre Forest | HWR | WM | Con | Con | 32,960 | 65.2% | 21,413 | 64.8% | 32,960 | 11,547 | 4,081 | 1,973 | 50,561 | ||||
| Wythenshawe and Sale East | GTM | NW | Lab | Lab | 23,855 | 53.3% | 10,396 | 58.7% | 13,459 | 23,855 | 3,111 | 1,559 | 2,717 | 58 | 44,759 | ||
| Yeovil | SOM | SW | Con | Con | 34,588 | 58.4% | 16,181 | 71.9% | 34,588 | 3,761 | 18,407 | 1,629 | 875 | 59,260 | |||
| York Central | NYK | YTH | Lab | Lab | 27,312 | 55.2% | 13,545 | 66.2% | 13,767 | 27,312 | 4,149 | 2,107 | 1,479 | 691 | 49,505 | ||
| York Outer | NYK | YTH | Con | Con | 27,324 | 49.4% | 9,985 | 74.1% | 27,324 | 17,339 | 9,992 | 692 | 55,347 | ||||
| Total for all constituencies | Turnout | Total | |||||||||||||||
| Con | Lab | LD | Grn | Brx | Other | ||||||||||||
| Votes | |||||||||||||||||
| 67.4% | 12,710,845 | 9,125,203 | 3,340,835 | 819,751 | 545,172 | 357,862 | 26,899,668 | ||||||||||
| 47.3% | 33.9% | 12.4% | 3.0% | 2.0% | 1.3% | 100.0% | |||||||||||
| Seats | |||||||||||||||||
| 345 | 179 | 7 | 1 | 0 | 1 | 533 | |||||||||||
| 64.7% | 33.6% | 2.1% | 0.2% | 0.0% | 0.2% | 100.0% | |||||||||||
Donations
Electoral commission data shows that in 2019 Q4, total donations for each major political party, over £7,500, are as follows:[2]
| Party | Donations | |
|---|---|---|
| Conservative | £37,658,712 | |
| Labour | £10,685,389 | |
| Liberal Democrats | £13,342,912 | |
| Brexit Party | £7,150,000 | |
| Green | £403,970 | |
See also
Notes
- ↑ Excludes spoilt ballots
- ↑ Includes Labour Party and allied Co-operative Party
- ↑ Excludes Speaker[1]
- ↑ Includes all other parties, all independent candidates and the Speaker
References
- 1 2 "Results of the 2019 General Election in England". BBC News.
- ↑ "Donations accepted". www.electoralcommission.org.uk. Retrieved 3 April 2020.