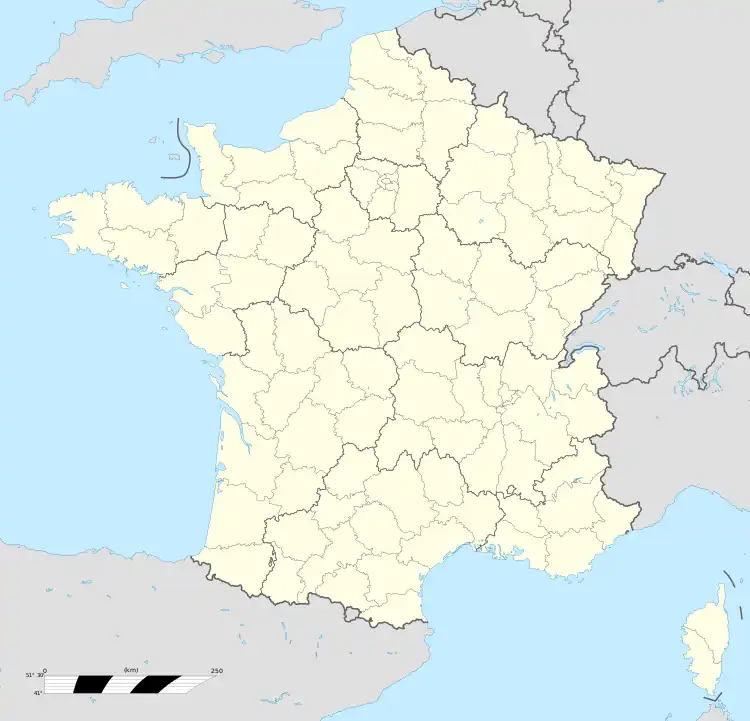
Crolles | |
|---|---|
 View of Crolles | |
Location of Crolles | |
 Crolles  Crolles | |
| Coordinates: 45°17′09″N 5°53′01″E / 45.2858°N 5.8836°E | |
| Country | France |
| Region | Auvergne-Rhône-Alpes |
| Department | Isère |
| Arrondissement | Grenoble |
| Canton | Le Moyen Grésivaudan |
| Intercommunality | CC Le Grésivaudan |
| Government | |
| • Mayor (2020–2026) | Philippe Lorimier[1] |
| Area 1 | 14 km2 (5 sq mi) |
| Population | 8,317 |
| • Density | 590/km2 (1,500/sq mi) |
| Time zone | UTC+01:00 (CET) |
| • Summer (DST) | UTC+02:00 (CEST) |
| INSEE/Postal code | 38140 /38920 |
| Elevation | 219–1,000 m (719–3,281 ft) (avg. 245 m or 804 ft) |
| 1 French Land Register data, which excludes lakes, ponds, glaciers > 1 km2 (0.386 sq mi or 247 acres) and river estuaries. | |
Crolles (French pronunciation: [kʁɔl]) is a commune in the Isère department in southeastern France.[3] It is located in the Isère valley, 20 km northeast of Grenoble, upstream on the river Isère. It has given its name to the Dent de Crolles mountain (2,062 m), which stands just above the city.
Industries
Crolles hosts the biggest semiconductor fabrication plant in France (employing 4,000 people, for a total investment of 3 billion euros). First founded by STMicroelectronics in the 1980s, the recent development (Crolles 2, 2003) results from a joint-venture with Philips (today NXP semiconductors) and Motorola.
Crolles is the birthplace of Petzl, manufacturers of safety equipment for mountaineering, caving and vertical safety in civil engineering, which still has its headquarters there and is also the site of the main manufacturing plant of Teisseire, a beverage company now owned by Britvic.
Population
|
| ||||||||||||||||||||||||||||||||||||||||||||||||||||||||||||||||||||||||||||||||||||||||||||||||||||||||||||||||||
| Source: EHESS[4] and INSEE (1968-2017)[5] | |||||||||||||||||||||||||||||||||||||||||||||||||||||||||||||||||||||||||||||||||||||||||||||||||||||||||||||||||||
See also
References
- ↑ "Répertoire national des élus: les maires". data.gouv.fr, Plateforme ouverte des données publiques françaises (in French). 2 December 2020.
- ↑ "Populations légales 2021". The National Institute of Statistics and Economic Studies. 28 December 2023.
- ↑ INSEE commune file
- ↑ Des villages de Cassini aux communes d'aujourd'hui: Commune data sheet Crolles, EHESS (in French).
- ↑ Population en historique depuis 1968, INSEE